


COMING SOON
- Process Designer enhancements by September.
- Data Integration IP Address Updates on eu-2, eu-3, jp-1, uk-1, and us-2 realms. Ensure your system IP allowlists include the latest Celonis IPs, and remove specific older IPs by September 17, 2025.
- Decommissioning of selected API & Application Keys before December 31, 2025.
PROCESS DESIGNER and PROCESS NAVIGATOR - Single Sign-On
You can now configure Single Sign-On (SSO) in Celonis Process Management. Users with the Administrator role can choose from SAML or OIDC based SSO. For existing customers, note that this feature will be rolled out to your workspace later this year.
For more information, refer to the documentation.
PROCESS NAVIGATOR - Chat button removed from details modal
We have removed the chat button from the details modal in Process Navigator. This was done in response to customer feedback and for the sake of simplicity. No other functionality is affected.
STUDIO Attribute filter uses Knowledge Model
You can now select the Knowledge Model to use when setting an attribute filter in your Studio Views, a change from previously selecting a Data Model. This update allows you to set filters based on the non-technical name given to attributes, making it easier for business users to filter their data.
To set an attribute filter within a View, click Filters - Attribute filter and select from the available Knowledge Model:
For more information about View filters, see: Filtering Views.
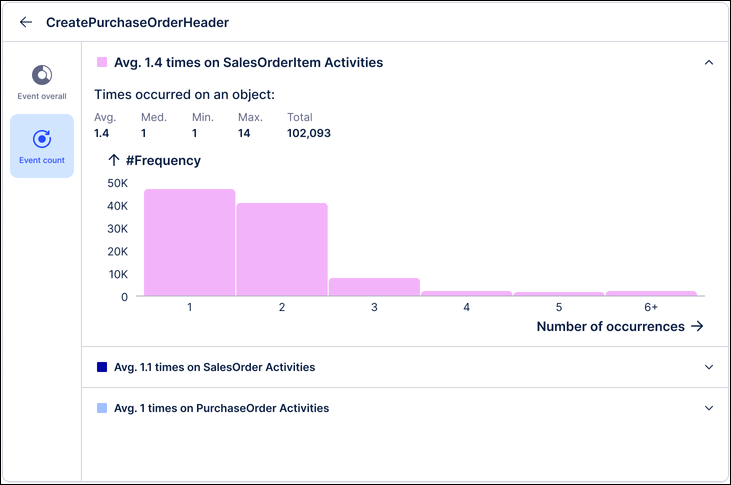
STUDIO Event count tab added to Event Explorer component
We've added an Event count tab to the Event Explorer component in Studio, allowing you to select objects where an event occurs less or more times than a defined start and end threshold e.g. only objects where "Invoice paid" happens more than once.
For more information about event count filters, see: Event / activity count filters.
And to learn more about the Event Explorer component, see: Event explorer.
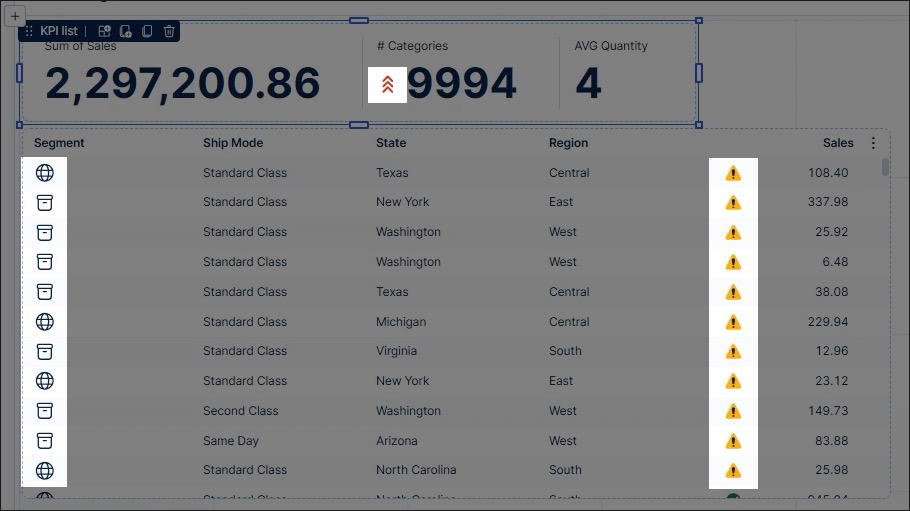
STUDIO Icon mapping added to Tables and KPI lists
You can configure visual icons for your table and KPI cards and list View components, allowing you to create reusable icon mappings based on your data types. These icons can be mapped to entries in your Knowledge Model, offering your App users a consistent visual experience.
Icons can be mapped based on thresholds and categories:
- Threshold mapping: Applying limit values (or "thresholds") to metrics, attributes, or data points in order to visualize whether those values fall within or outside certain ranges.
- Categorical mapping: Assigning icons to specific categories, such as the status of an order, location type, or material type.
In this example, icons have been used for a KPI list (threshold mapping) and a table (both categorical and threshold mapping):
To learn more about icon mapping for your Studio Views, see: Icon mapping.
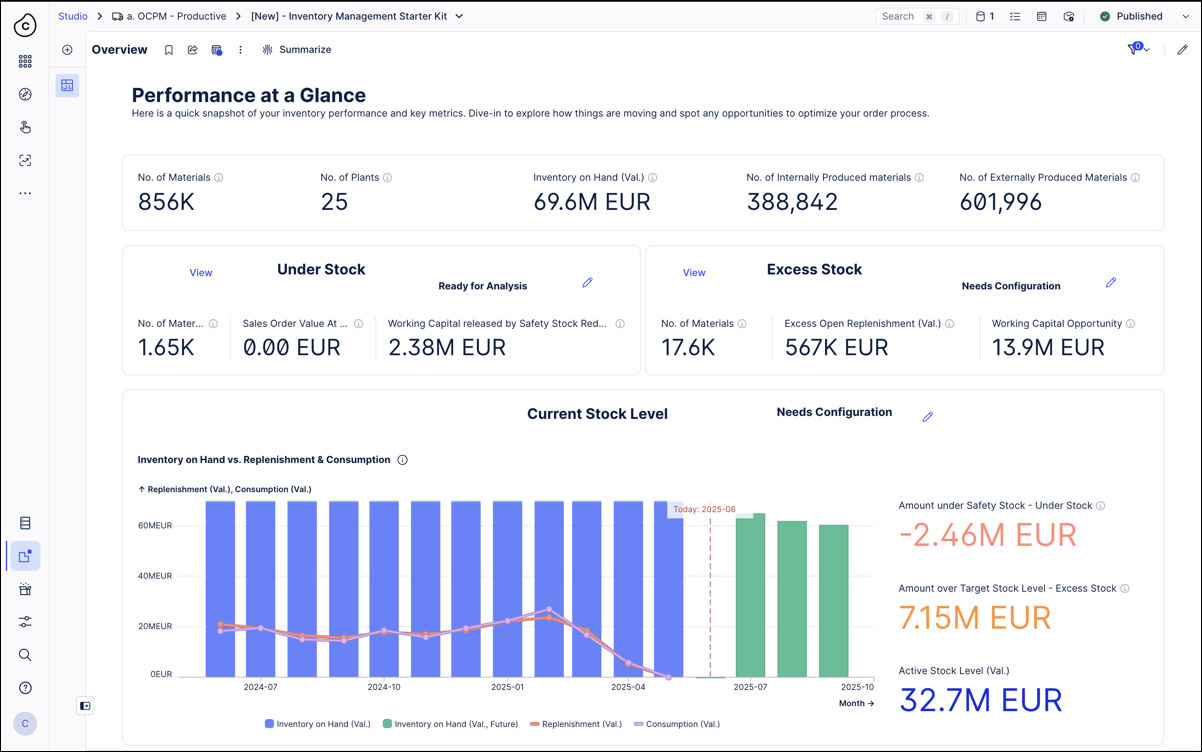
STUDIO Visual enhancements to Views
We're making a number of enhancements to our Studio and Views user interfaces, improving your overall View editing experience within the Celonis Platform.
These enhancements include:
- KPI font: Introduced a new KPI font styling for improved readability and modern aesthetics.
- View border: Removed the previous View border, giving a more cleaner and consistent style across the platform.
- View and tab background: Updated View and tab background to an all-white appearance, ensuring that the background colors don't interfere with components or data.
- Consistent display sizes: Switching between non-edit and edit mode no longer changes the size of the View, providing a consistent display experience.
- Navigation bar: The background color of the navigation bar changes based on context, helping to visually distinguish between components and features.
- Additional enhancements: These changes are too minor to stand alone but collectively contribute to a cleaner, more refined experience. This includes tweaks to spacing, padding, alignment, and other UI details that improve consistency and visual balance across the product.
TASK MINING Create Business Events by adding business context to captured user activities [Private Preview]
We've added a new user interface that lets you group user activities captured in Task Mining and add business context to create semantically-meaningful Business Events. Adding these Business Events to process graphs provides clearer and more granular process visualizations, without overwhelming 'click-level' detail or writing complex SQL queries.
For more information, see Business Events.
This feature is currently available as a Private Preview only
During a Private Preview, only customers who have agreed to our Private Preview usage agreements can access this feature. Additionally, the features documented here are subject to change and / or cancellation, so they may not be available to all users in future.
If you would like to use this feature, create a Support ticket at Celopeers.com.
For more information about our Private Preview releases, including the level of Support offered with them, see: Feature release types.