Observations:

  1. Same sheet takes different time to load for different people
  2. Same sheet takes different time to load for the same person at different time of the day
  3. Initial hits to the sheet take longer time to load and subsequent hits to the same sheet load faster

Remember Celonis UI is browser-based --> javascript code and html resources need to download, execute, etc....


So usually is more a local browser problem.

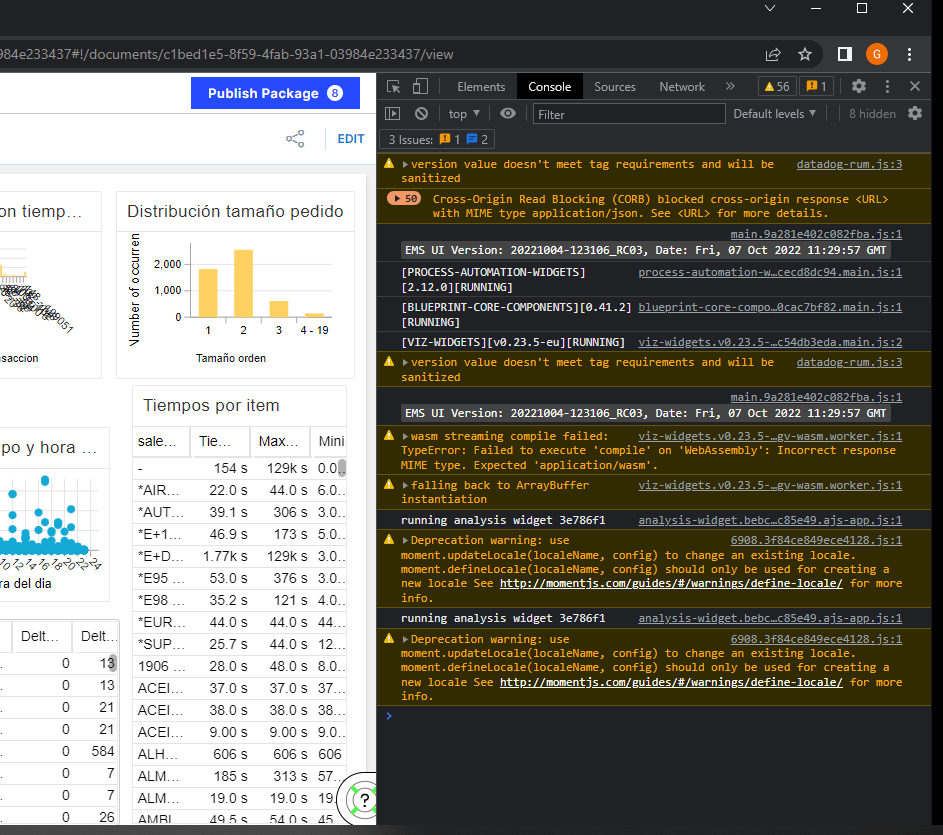
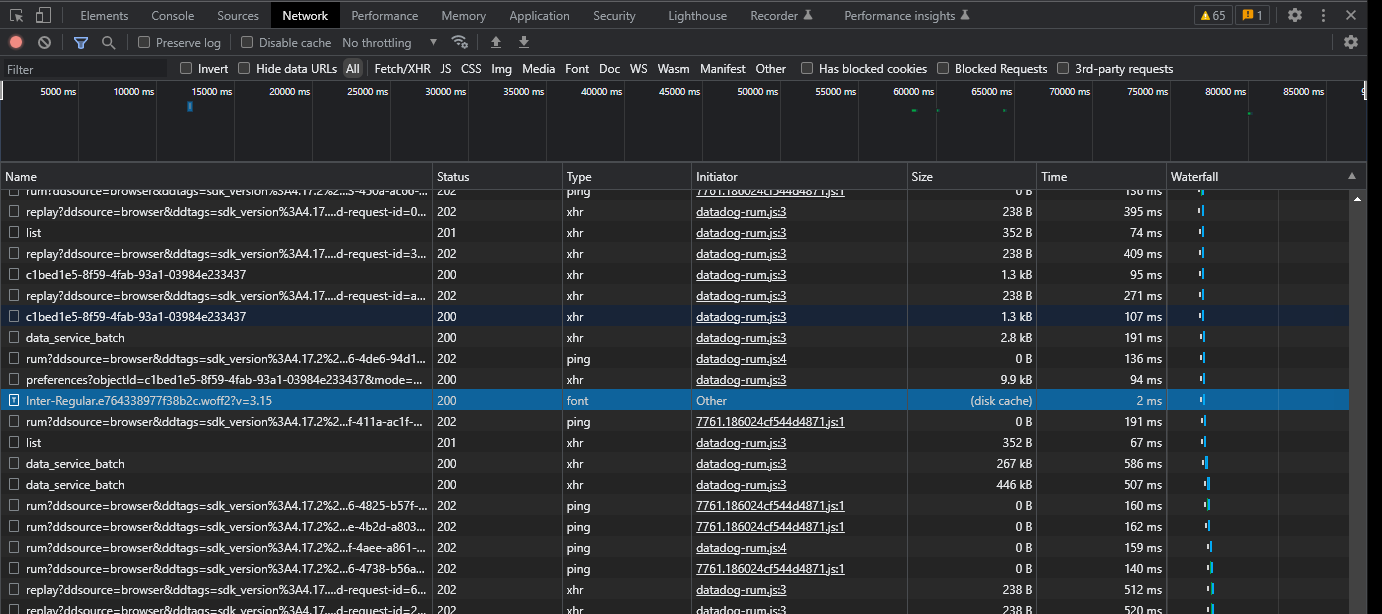
I would log with Developers tools of the browser a full session and then check the load times, errors, etc...


image 

image 

HTH


Remember Celonis UI is browser-based --> javascript code and html resources need to download, execute, etc....


So usually is more a local browser problem.

I would log with Developers tools of the browser a full session and then check the load times, errors, etc...


image 

image 

HTH


Hi Guillermo, thank you for your reply.


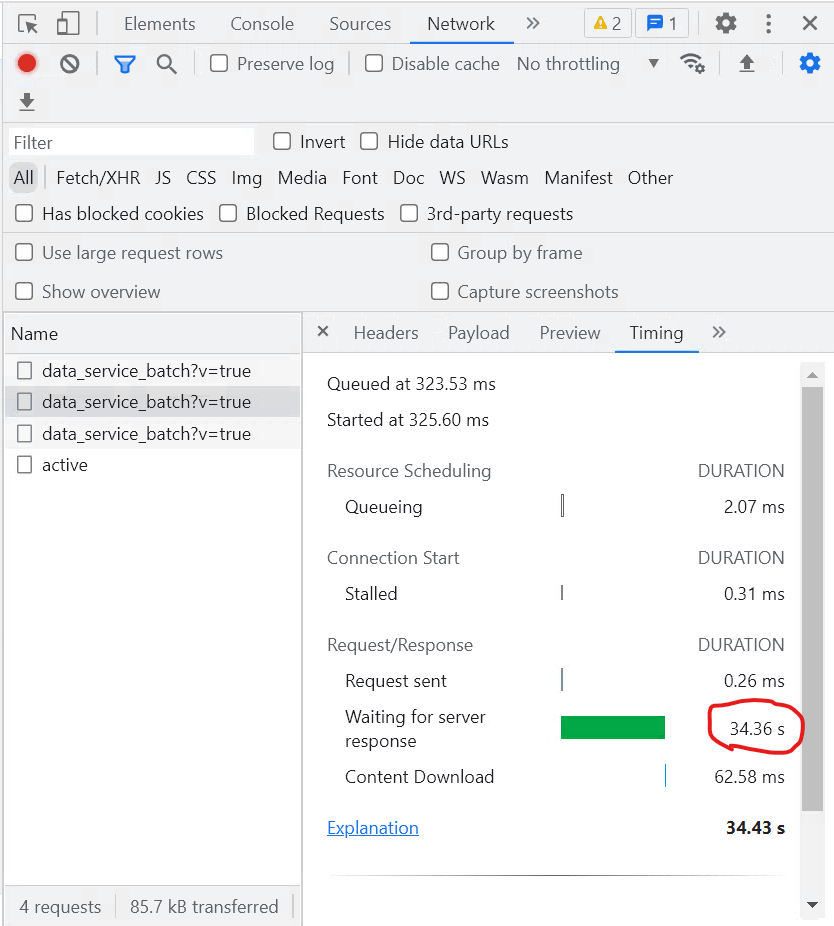
I see this (below image) in developer tools, which clearly says Celonis server takes about 34.36 seconds time to respond. What are the possible reasons for this?


Moreover, as I mentioned in my observations above, the same sheet loads faster in subsequent hits. So, what might be the possible reason for this?


image.png 


"Moreover, as I mentioned in my observations above, the same sheet loads faster in subsequent hits. So, what might be the possible reason for this?"


I'd think that the delay is in loading some resource, thus in the next load, as you already have it in cache, it is faster...


"says Celonis server takes about 34.36 seconds time to respond. What are the possible reasons for this?"


It can be a lot of reasons, from your conection to Celonis, to some plugin in your browser to... ......

The most likely reason will be some problem loading a resource. I'd suggest saving the log and open a ticket to Celonis.


Otherwise you will need to dig yourself... like checking the details of the timing to see exactly which resource is taking that long, and checking then inside to see more details


Guillermo is right in his observations.

From practical experience, the more components you have on the same sheet and the more complex the PQL calculations, the longer it will take to load.


Also, cached operators run way faster than uncached (Operators with filtered input are not

cached (e.g. Aggregations, FILTER_TO_NULL, ...), so take this into consideration when writing your PQL queries.


Thank You Gabriel for your response.


Apart from optimizing components and PQL, I am thinking if the load on Celonis server is causing this issue. If so, does increasing the APC OR number of users improve the speed of response?


Reply