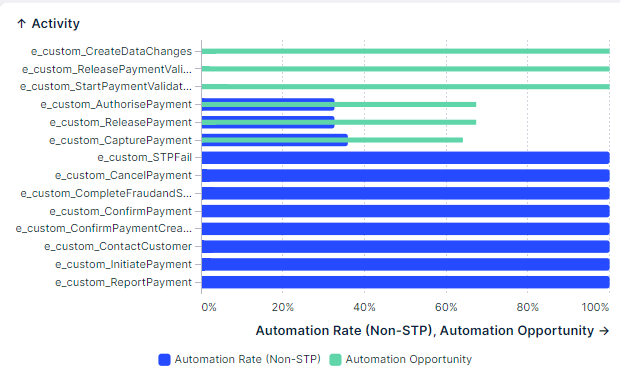
I would like to have the green start where the blue stop (Stacked graph)- how can I do that?

 +6
+6I would like to have the green start where the blue stop (Stacked graph)- how can I do that?
No account yet? Create an account
Enter your E-mail address. We'll send you an e-mail with instructions to reset your password.
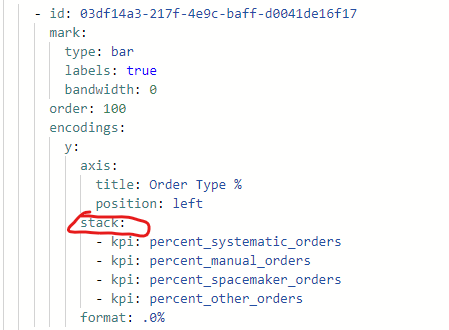 In your YAML, you'll want to code in the field "stack:" and then list the KPIs you want to stack.
 I find using the YAML better so you can have more control over what it looks like.