


It's Thursday afternoon at the same industrial motor manufacturer, and the monthly supply review has reached the item everyone was waiting for. Castings for the flagship drive have been late three times this quarter. The materials manager proposes raising safety stock on castings by 20 percent. Finance asks what that costs. Somebody asks a sharper question: what if the supplier gets worse, not better?
Each person in the room has an answer, and each answer is an opinion. The materials manager has a spreadsheet that multiplies average weekly usage by a few extra days. Finance has the carrying cost. Someone re-ran the planning system with the higher buffer over last quarter's data and got a fill rate one point better. Nobody can say whether that one point is the effect of the change or the effect of last quarter happening to be the way it was. The decision gets made the way most of these decisions get made: by whoever argues most convincingly, with a promise to review it again next quarter.
At the end of Part 2 we said that knowing the shape of what could happen is not the same as knowing what to do about it. What-if simulation is how you close that gap. It turns "I think a bigger buffer would help" into a hypothesis that can be tested against thousands of possible futures and compared, on equal terms, with the way the business runs today. This post is about the mental model behind that: what a scenario is, what you compare it against, and how to read the answer so you can defend it in that Thursday meeting.
Operations have no formula from inputs to outputs
If there were a reliable formula from "safety stock" to "fill rate", the meeting would take five minutes. There isn't one, and the reason is that operations behave in ways intuition handles badly.
Take the castings buffer. What it does for fill rate depends on how late the supplier is, how large and lumpy the customer orders are, how much spare capacity the line has to catch up after a shortage, and which orders get the castings when they run short. These interact. A late shipment is harmless when the line has room to catch up and expensive when it is running full, because the lost shifts are never recovered. A bigger buffer is worth a lot in a bad month and almost nothing in a good one. And the effect of a decision shows up weeks later, mixed in with everything else that happened in between.
So twice the buffer does not buy twice the benefit, and the benefit seen last quarter says little about next quarter. Add uncertainty, and nothing connects the decision to the outcome in a way you can write down, and judgement alone cannot reliably fill the gap. When there is no formula, the way to learn how a system responds is to experiment on it.
What-if simulation as a controlled experiment
The idea is simple. Change one input, keep everything else fixed, and see what happens to the outputs. If the outputs move, the change caused it.
You cannot do this on the real business. If the team raises the buffer in July and compares the third quarter with the second, the difference mixes the buffer with everything else that changed: different orders, a better month from the supplier, one line stop fewer. There is no second plant running the same quarter with the old buffer.
A simulator gives you that second plant. It is the context model from Part 1 put in motion, and each question from the meeting changes one of its blocks while the others stay fixed.
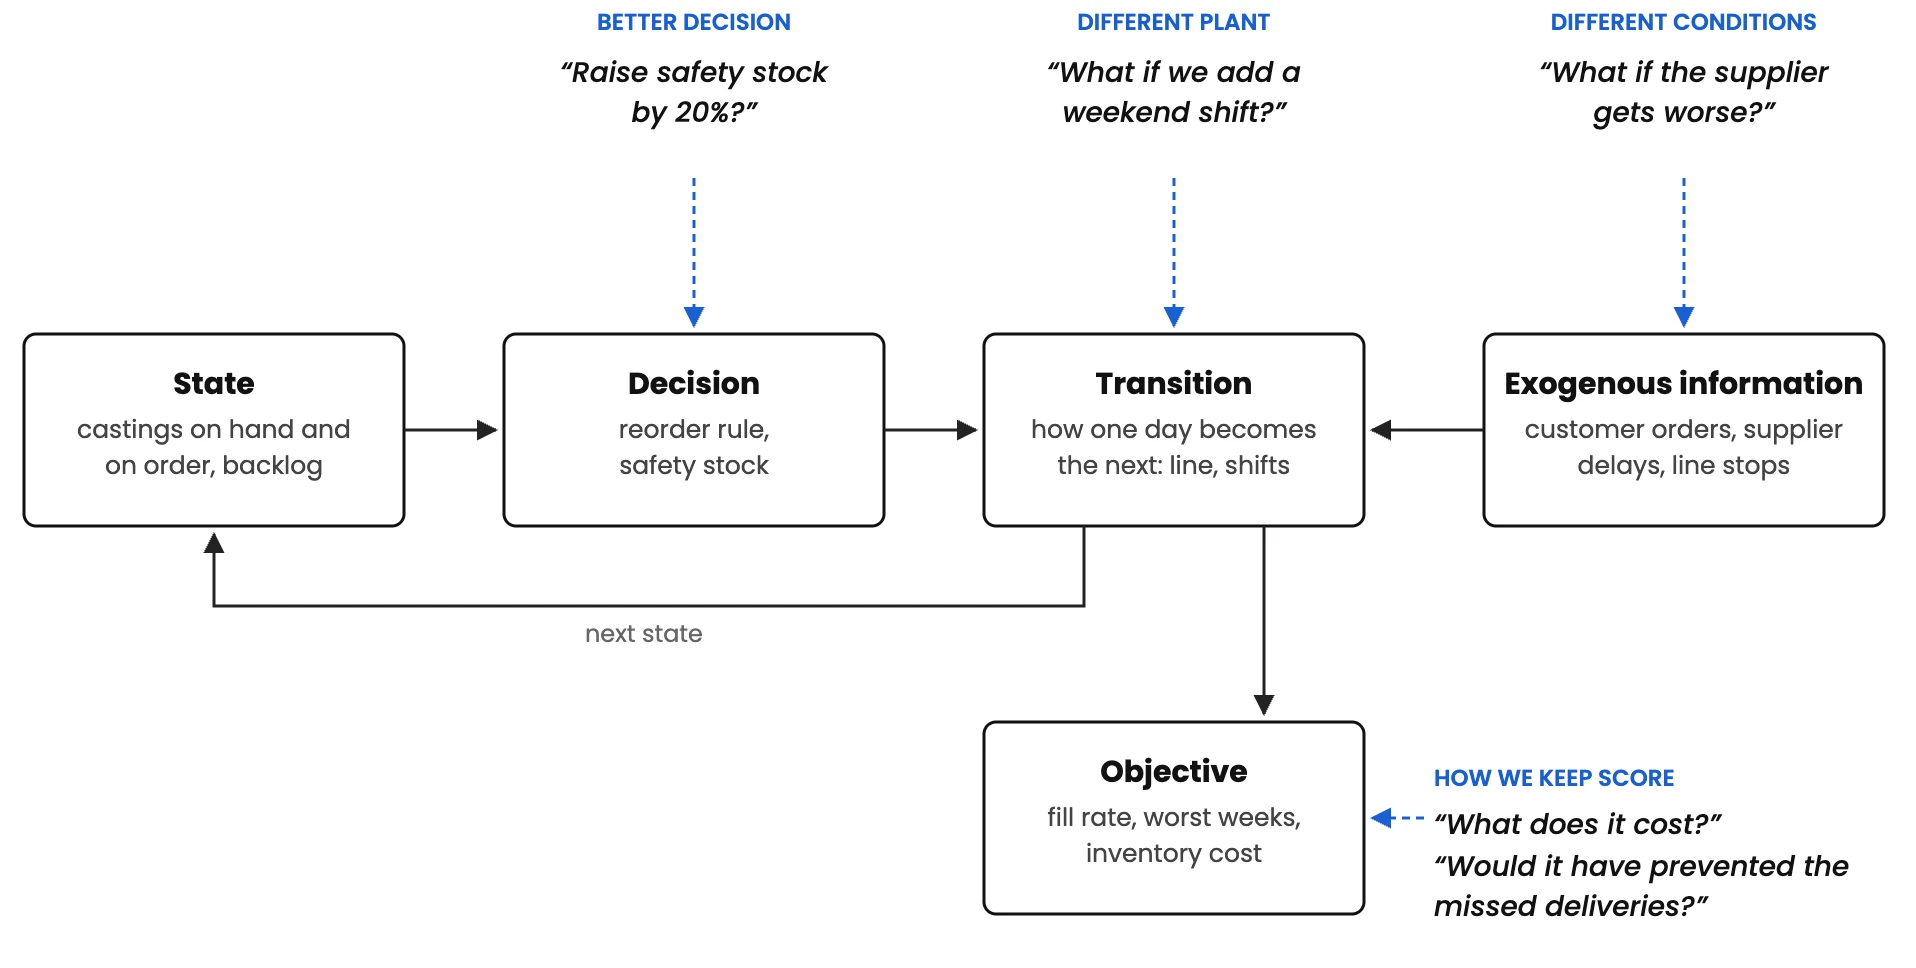
Raising safety stock tests a better decision. A worse supplier tests different conditions. An extra weekend shift tests a different plant. Every answer is read from the same objective. And because the exogenous information is generated by the simulator rather than lived through, the same sequence of events can be replayed exactly with and without the change.
The first version is the base scenario: the operation as it runs today. Before it is used for anything, it has to reproduce today's numbers from the process data: fill rate, inventory, how often stock-outs happen. If it doesn't, the model is missing something real, for example the expediting planners do by hand, and every comparison built on it inherits that gap. Once it matches, every what-if is a change to this base, and every result is read as a difference from it. The question in the room is never "what is the fill rate". It is "is this better than today, and by how much".
Two things make the experiment honest under uncertainty.
The first is that each scenario is played against many possible futures, say 500 simulated years with their own demand, supplier delays and breakdowns, instead of one historical quarter. The output is a range, so you see the bad weeks as well as the average.
The second is that "keep everything else fixed" includes the luck. Base and change are played against the same 500 futures. In future number 37, the big order lands on the same Tuesday and the castings slip by the same four days in both. The only thing that differs is the change you made, so the difference in outcome is caused by it and not by one scenario drawing a kinder year. This is what makes the isolation real, and it makes comparisons far sharper than running each scenario on its own random futures.
Testing the castings question
The numbers below come from a simulation of a simplified version of this plant, built for this post.
Today: the base scenario
The base runs today's reorder rule, a safety stock of six days of demand, and today's supplier. Across the 500 years it ships 94.1 percent of orders on time and holds €2.5 million of castings. That average hides two very different kinds of week. In nearly nine weeks out of ten, every order ships on time. In two or three weeks a year, more than half ship late, because a late shipment, a line stop or a spike in orders leaves the plant short and the line needs days to catch up. Those bad weeks are what the meeting is really about, so every result below reports the worst 5 percent of weeks next to the average. Today, in those weeks, only about half of the orders ship on time.
Question 1: should we raise safety stock by 20 percent?
Yes. Plus 20 percent raises on-time delivery by 1.7 points and lifts the worst weeks from 50 to 74 percent, for €0.22 million more inventory.
Why 1.7, when the re-run in the meeting showed one point? It is easiest to see by measuring the same change in three ways.
| How you measure it | What +20% safety stock appears to do |
| One year with today's buffer, compared with a different year with the new one | Anywhere from 10 points worse to 15 points better. Worse than today 41% of the time. |
| One year, replayed with both buffers | Never worse, but anywhere from 0 to 5 points better. |
| 500 years, each replayed with both buffers | 1.7 points better, with a range of 1.5 to 1.8. |
The first row is a before-and-after on the real business: the two periods differ in so much more than the buffer that you cannot even tell whether it helped. The second row is the re-run in the meeting. Replaying the same history with both buffers makes the buffer the only difference, so the direction is right, but one year can show anything from zero to five points depending on how many late shipments it happened to contain. The third row replays each of 500 histories with both buffers. The same futures take luck out of the comparison, and many futures remove the dependence on one particular year.
Question 2: what if the supplier gets worse?
Here the change is to the world, not the decision. The table repeats each buffer level with a supplier that is late twice as often.
| Safety stock | Supplier as today | Supplier late twice as often |
| Today | 94.1% | 90.4% |
| +10% | 95.0% | 92.0% |
| +20% | 95.8% | 93.4% |
| +30% | 96.4% | 94.6% |
Share of orders shipped on time, average over 500 simulated years. Same futures in every cell.
The buffer is worth almost twice as much when the supplier is worse: plus 20 percent buys 3.0 points instead of 1.7. And plus 30 percent is enough to hold today's service if the supplier does get worse. Tested only against today's supplier, the buffer looks like a modest improvement. Tested against both, it is insurance against the supplier. That is why some inputs have to be tested together.
Question 3: would a Saturday shift do more?
This one changes the plant, with today's buffer and supplier.
| Option, today's supplier | On time, average | On time, worst 5% of weeks | Castings inventory |
| Today | 94.1% | 50% | €2.54M |
| Safety stock +20% | 95.8% | 74% | €2.76M |
| Safety stock +30% | 96.4% | 82% | €2.87M |
| Saturday shift | 97.1% | 93% | €2.46M |
The shift does more than any buffer tested, most of all in the bad weeks, and needs slightly less inventory. After a late shipment or a stoppage, orders pile up, and a five-day line can only work them off with the little spare capacity left each day. A Saturday gives it a full extra day, so one bad event stops spilling into the following weeks. The size of the effect depends on how much spare capacity the line has, and the shift costs labour rather than inventory, so the table says what each option buys, not which is cheaper.
What this changes in the meeting
The room came in asking how much safety stock to add. It leaves with three findings anyone can check. A bigger buffer works, and it is worth most as protection against a worse supplier. The bad weeks get bad because the line catches up slowly after a shortage, and a Saturday shift fixes more of them than stock does. The remaining decision is whether the shift costs less than the bad weeks it removes, and finance can now answer that with numbers on both sides.
None of this replaced the experience in the room. Every question came from someone who knows the plant. The simulator gave each question a fair test.
Notice, though, that every scenario here came from someone's idea, and each one had to be set up and read by hand. With a few levers that works. With dozens of interacting levers across a network, or when the question is "what is the best setting" rather than "is this setting better than today", testing hypotheses one by one stops scaling. In the next post we look at simulation-based optimization: letting the simulator search the space of policies and settings itself, using the same base model and the same fair comparison, to find the ones that hold up best across the futures you may face.
Celonis is running select customer co-innovations to turn this framework into an easy-to-use product, so that the next time someone in the room asks "what if?", the answer comes from an experiment rather than an argument.