


A planning system runs overnight and produces a beautiful plan. By Tuesday the plan is fiction, because a customer tripled an order and a supplier's castings slipped three days, and neither event was in the forecast. We have argued in this series that the deeper fix is a shift from plans to policies: from one fixed answer for one imagined future, to a way of deciding that keeps working as the situation changes. And we were careful about something worth repeating, which is that a better forecast changes what you know, not how you decide.
Both things are true, and this is still the right place to start. It is the step you can take this quarter with data already sitting in your ERP, and it makes the rest possible, because you cannot simulate uncertainty you have never measured. Before you can test a policy against the range of futures it will meet, something has to tell you what that range looks like.
So here is the least glamorous and most immediately useful idea in the series: a forecast that admits, out loud and in a number, that it might be wrong.
You already trust quantile predictions
When a retailer tells you your parcel arrives Tuesday to Thursday, you do not read that as evasion. You read it as honesty, and you plan around the Thursday. Nobody has ever cancelled an order because the delivery estimate came as a range.
The big retailers do not publish how those windows are computed, so treat that one as intuition rather than evidence. Plenty of other companies have published, and they all landed in the same place. Uber's arrival-time model is trained with an asymmetric loss whose whole point is to let you set the cost of predicting too low differently from predicting too high, the illustration being that a minute late is worse than a minute early. Myntra published a customer promise-date system built on gradient-boosted quantile regression, chosen because it was the only approach that let them hold broken promises under a rate the business had fixed in advance. And airlines have been padding published block times for decades, which is why a two-hour flight takes two hours and forty minutes on the ticket and then lands early. That is not incompetence. That is a quantile, sold as a schedule.
The pattern is consistent: when a number will be used as a commitment rather than as an estimate, the middle of the distribution is the wrong part to publish.
What quantile regression actually does differently
Ordinary regression answers "what is the average outcome, given what I know?"; Quantile regression answers "what number will the outcome stay below 70 percent of the time, given what I know?." Both are fitted to the same history. They are simply asked for different things.
The mechanism comes down to one change, and it is the whole idea. Ordinary regression minimises squared error, which has a consequence nobody states out loud: being ten days too optimistic and ten days too pessimistic are priced as the same mistake. No part of your business agrees with that. Ten days early is a crowded warehouse. Ten days late is a line stoppage, an expedite premium, and a phone call you did not want to make.
Quantile regression changes the price of being wrong, and charges a different price in each direction. Ask for the 70th percentile and under-predicting becomes a little over twice as expensive as over-predicting. The model has no opinions, so it goes where the penalty is cheapest, and settles on the line where roughly seventy percent of outcomes fall below. Ask for the 90th and the asymmetry steepens and the line moves up. Ask for the 50th and the penalties balance, and you get the median.
Nothing else has to change. Same features, same gradient-boosted trees, same training pipeline. You swap what counts as a mistake, and what comes out answers a different question. The framing that lands best with planners: you are not making the model pessimistic, you are telling it which mistake you cannot afford.
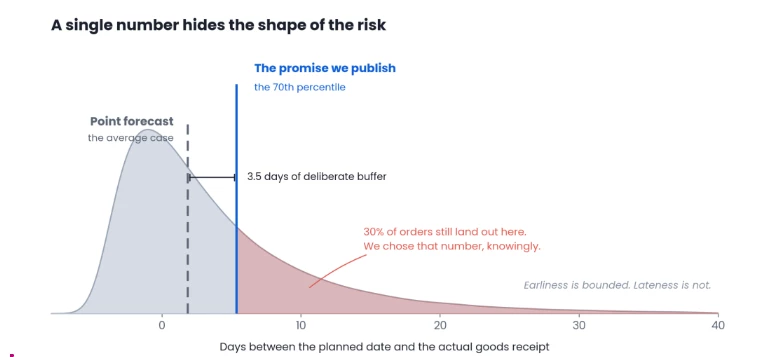
Figure 1. The distribution of how wrong the planned date turns out to be. The point forecast sits in the middle of the shape. The number you publish does not have to. Illustrative distribution, not customer data.
Three things follow from this, and they are more practical than they sound.
First, you get a dial your planners are already turning. A cycle service-level target maps directly to a quantile: “I want a 95 percent chance of avoiding a stockout during replenishment” sets the reorder point at the 95th percentile of lead-time demand. Safety stock is the gap between expected demand and that percentile. Planners have long estimated this using a bell-curve assumption and a z-value. Quantile regression can estimate the relevant percentile directly, conditional on the material, supplier and lane, without requiring the distribution to be symmetric, which it often isn't.
Second, it respects skew, which matters enormously here. Delivery-date error is lopsided by construction: a shipment can only be so early, because eventually it arrives and nobody minds, but it can be late without any obvious limit. A customs hold, a missed vessel, a supplier who has quietly deprioritised you. So the distribution has a long right tail, the mean gets dragged into it, and the average becomes the one number that is wrong in both directions at once. Too gloomy for a normal week, far too cheerful for a bad one. A quantile is also harder to bully: one container stuck at a port for sixty days moves a squared-error model's prediction for every order that looks like it, and barely moves the 70th percentile.
Third, you can ask for several at once. Fit the 50th, the 70th and the 95th and you have the shape of the risk rather than a safer single number, which matters for what comes later in this series, because a simulator needs a distribution to sample from.
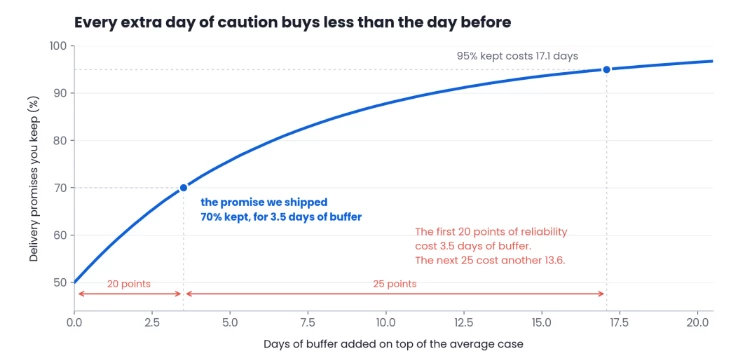
Figure 2. The dial has a price, and the price is not linear. Going from half your promises kept to seventy percent costs a few days of buffer; reaching ninety-five costs several times more. This curve is the conversation to have with the business, and quantile regression is what lets you have it with numbers instead of instincts. Illustrative distribution, not customer data.
Two honest caveats. Fit each quantile separately and they can come out in the wrong order, with the 70th percentile above the 80th, which is nonsense and needs fixing before anyone sees it. And a quantile forecast is worth exactly what its calibration is worth: one asked for the 70th percentile that holds seventy percent of the time is doing its job, while one that holds fifty-five percent has sold you false comfort with a confident label on it. Check it on data from after the training period, and keep checking.
A head-to-head against the ERP date
We are running exactly this with a European manufacturer, on inbound goods receipt. We set it up as a comparison rather than a rollout: for about six weeks, both dates stood side by side on live orders, SAP's planned goods receipt date and ours, and each was then scored against what actually turned up.
The design decision worth stealing is that we did not predict the delivery date. We predicted the error in the planned date, the gap in days between what SAP said and what actually happened, and added the 70th percentile of that error back onto the planned date. That is a much better learning problem, because the model is not asked to rediscover lead times, transport modes and calendars from scratch. It is asked to learn where the existing plan is systematically wrong, and that has real structure in it, because the same lanes, suppliers and material groups drift in the same direction over and over.
Measured against actual arrivals, the ERP date was on time 70 percent of the time and late 16 percent of the time. The quantile date was on time 76 percent and late 10 percent.
This is a measurement of forecast quality on live data; a better-calibrated date buys the chance to act earlier. However this could bring up the objection you are already forming: your date is simply later, so of course it gets met more often. Fair, and worth taking seriously. Part of the answer is that an upper quantile is supposed to sit above the middle, and that the ERP date was already missing roughly a third of the time, which makes it less a promise than an aspiration with a calendar icon next to it. The more interesting part is that this is not a flat pad. A flat pad has to be sized for the worst lanes, which makes every well-behaved order needlessly pessimistic, whereas a conditional quantile adds days where the drift is real and almost none where it is not. That is the whole reason it beats ERP estimates.
Where this goes next
A quantile tells you what could happen to one order. It says nothing about what to do when two customers want the same pallet on the same day and only one of them can have it.
That is the availability question, and it is where a range stops being a nicer forecast and becomes a commitment. An availability check that can say "the 20th, here is how confident we are, and here is which constraint is driving it" is a different instrument from one that returns a bare date with no traceable reasoning behind it. Confidence you can act on and an explanation you can defend to a customer are both things a quantile makes possible and a point forecast cannot, and it is one of the directions we are actively exploring with customers.
The honest sequence runs through simulation first, though. Knowing the shape of what could happen is not the same as knowing what to do about it, and the gap between the two is where most good forecasts go to die. In the next post we look at what-if scenario simulation: how you put a distribution in front of a domain expert, let them interrogate it, and turn a range of possible futures into a decision somebody is prepared to sign.