
Dear all,


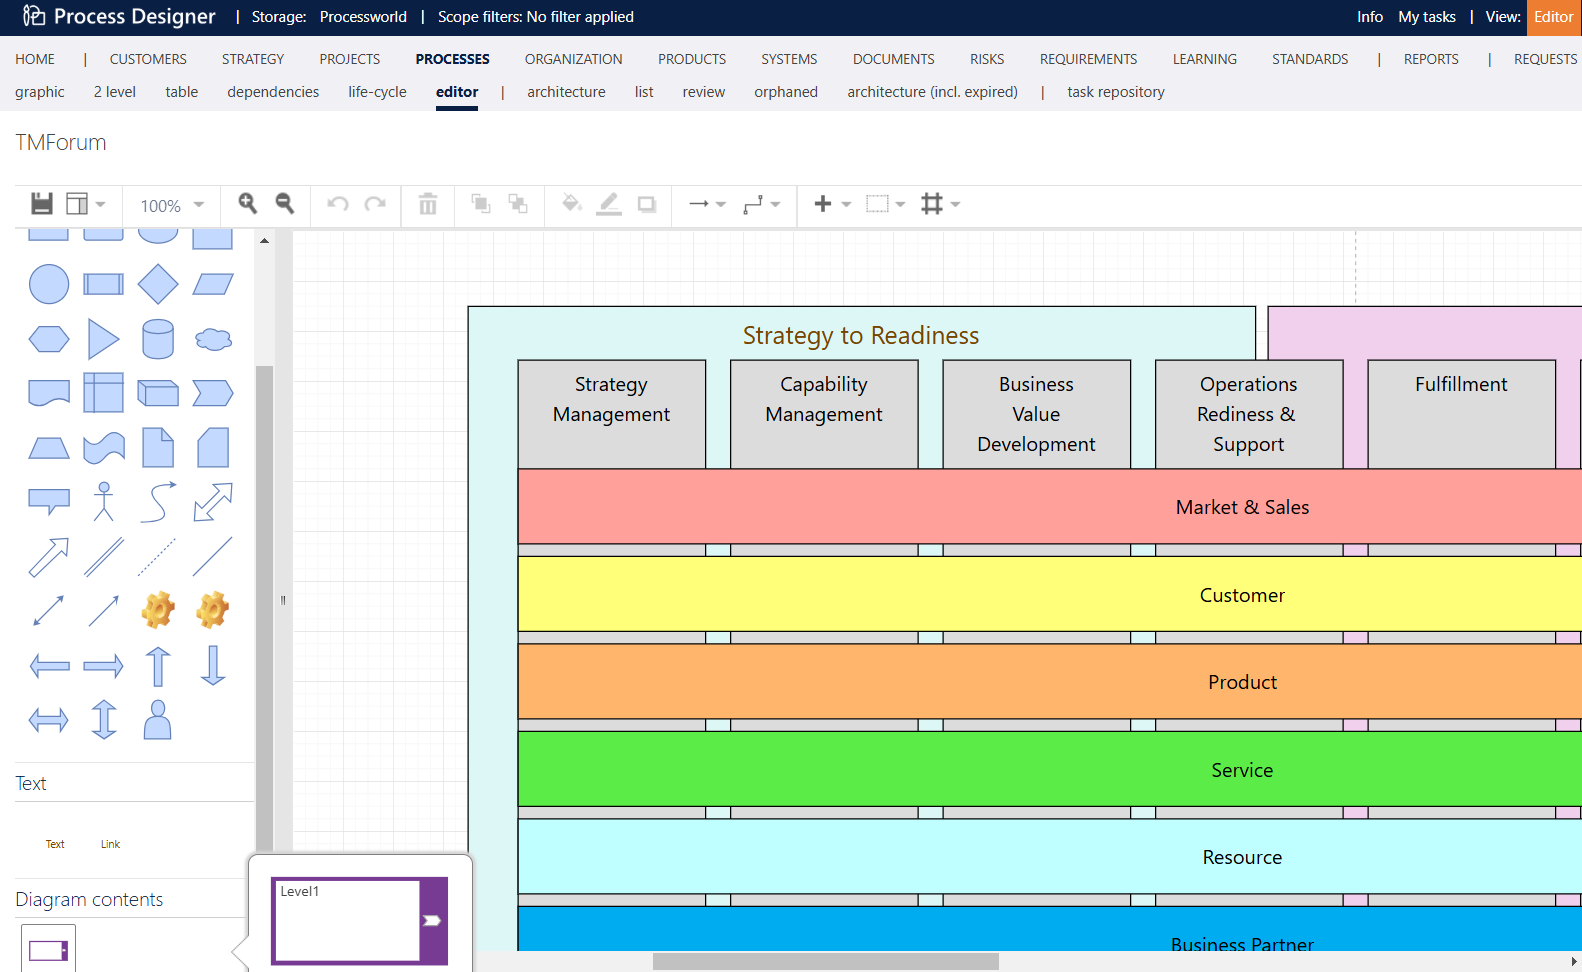
I’d like to describe the process map like TMForum in the Process Designer .

Like this : https://www.tmforum.org/certifications-awarded/huawei-digital-crm/business-process-framework/


TMForum eTOM

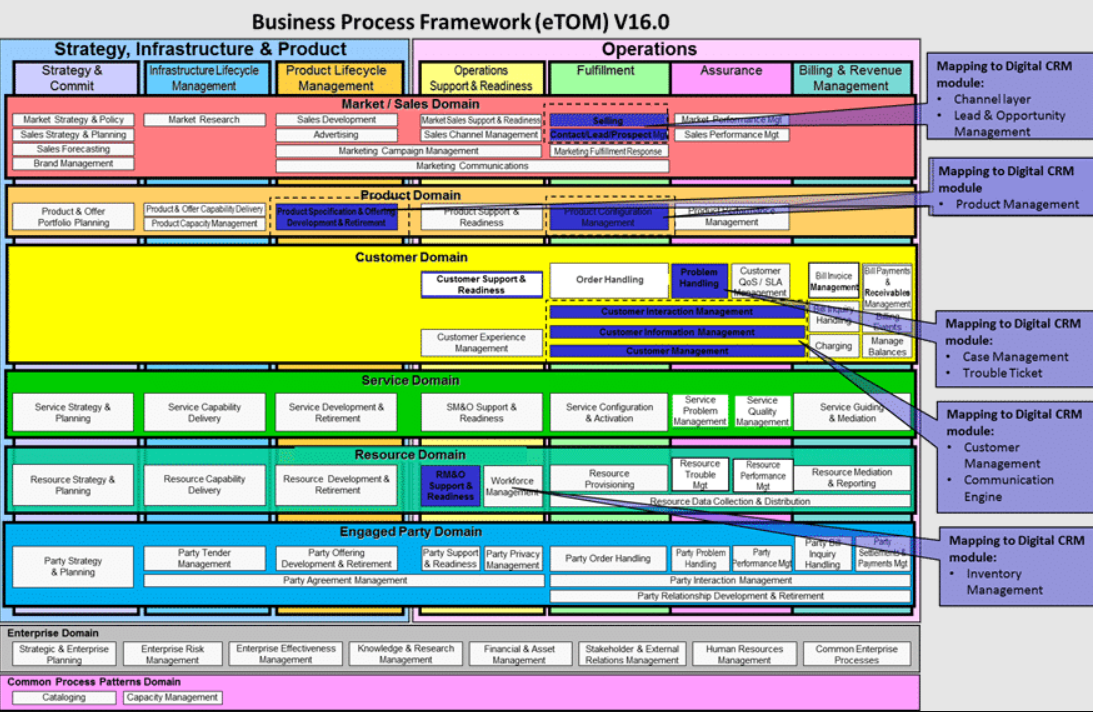
There are the horizontal part and vertical part.

When we use the hierarchical edit alone, it cannot describe so I think that graphic is useful for me to do that.


In graphic edition, we can use some diagram like ppt, but this will not be stractured.

So I’d like to keep stractured and reuse the process I made as possible as I can.


I ask you to advice on which parts should be presented as graphics and which parts should be structured as text.


Regards,

This picture is often called the Process House, or Process Map and is the highest level of process overview that you typically find in BPM tools. 

In the Editor you can create the graphical design, and you don’t need to add text yet. When you define the clickable areas (or hotzones) with the Link-object in the left hand pane, it will take the text from the process that you are actually linking. So, for example, if you want to add the “Marketing and Sales” text, you can create the coloured rectangle without text, then overlay the link-object, create the reference to the existing “marketing and sales” main process and by doing that, the text will appear on the coloured rectangle. 


@caspar.jans 

Thank you for your reply.

This picture is often called the Process House, or Process Map and is the highest level of process overview that you typically find in BPM tools. 

Yes, I think I start to understand this is not graphical tool but BPMN tool. I use this map in the highest level from now on.


Reply