
Question

Color Mapping based on flexible value

  • July 9, 2026
  • 1 reply
  • 124 views

philipp.finze
Level 3
Forum|alt.badge.img

Dear Celonis Community,

I’m trying to set up KPI Meters with a certain color mapping to visualize performance against targets and benchmarks.

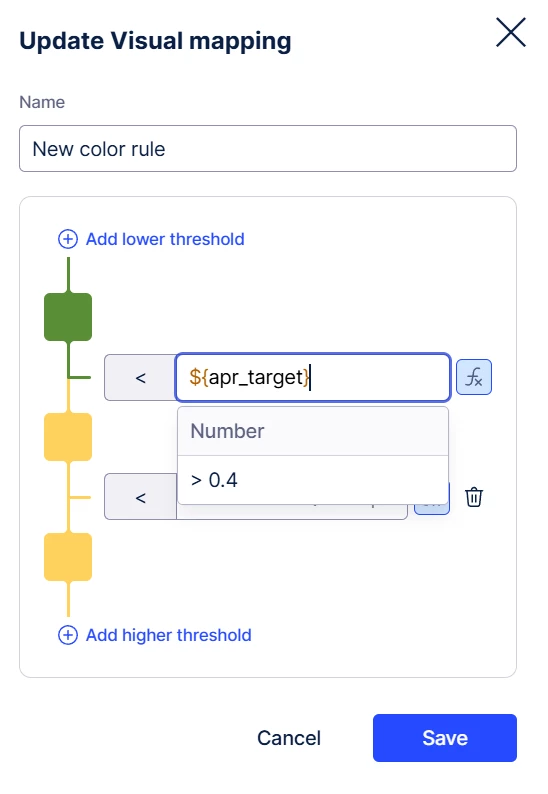
Users can already define targets via a variable which is also possible to include in the color mapping.

We managed to create global benchmarks via a write back to a custom Celonis table.


Would there be a possibility to make these benchmarks a threshold?
I figured that PQL inside the color mapping does not work.



1 reply

gagan1
Member Spotlight
Forum|alt.badge.img+5
  • Member Spotlight
  • July 10, 2026

Hi ​@philipp.finze ,
 

The visual mapping UI only takes static numbers or variables, it won't parse raw PQL. Since you already have the benchmarks in a custom table, you can get around this in a few ways.
 

First, create a KPI in your Knowledge Model with the PQL that pulls the benchmark from your custom table. Then create a View variable and use an input component (like a dropdown or button) to set it from that KPI value. Once it's stored in a variable, drop ${your_variable_name} into the threshold box the same way you're already doing with ${apr_target}.
 

Second, you can change your main KPI formula to output a ratio (Actual / Benchmark) and set a static threshold of 1 (= 100%). Cleanest approach if you don't need the raw benchmark number on the dashboard.
 

Third, write a CASE WHEN in your KPI that returns text categories (like 'On Track' or 'Critical') based on the benchmark comparison, then use Categorical color mapping to assign colors to those labels.