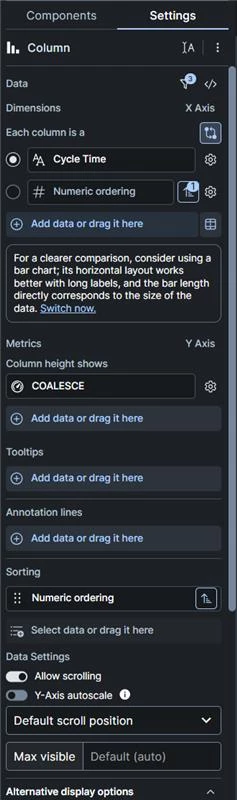


Problem Description: In a Celonis Studio View, I am creating a column chart to display process cycle times, which are categorized into different intervals (buckets) using a CASE WHEN statement. During this process, two main issues occur:
Missing Columns/Categories for Empty Data (NULL / No Data): If no records exist for a specific interval within the current filter context, the corresponding interval is not displayed as an empty category (a bar with value 0) on the X-axis; instead, it is simply omitted from the chart. This results in missing segments along the axis labels, making interpretation difficult.
Incorrect/Alphabetical Sorting of the X-Axis: Since the CASE WHEN statement returns text labels for the intervals (e.g., '-15 - 0', '0', '1 - 9'), Celonis defaults to sorting the X-axis alphabetically rather than logically/numerically. Manually overriding this via the Sorting field with a separate numeric PQL formula (CASE WHEN ... THEN 1 ... THEN 2) does not yield the desired result, as dynamic sorting expressions are restricted within the View component editor or fail to update the layout as expected.
In the old Process Analytics views, the Advanced Component Options included the setting "Partition rule (integer) = Explicit boundaries". This allowed fixed boundaries (e.g., -45, -30, -15, 0, 1, 9, 29, 59) to be defined directly within the component settings. This automatically rendered empty categories and ensured correct numerical sorting.
X-Axis PQL Example (Current Approach):
CASE
WHEN "TABLE"."cycletime" < -45 THEN '< -45'
WHEN "TABLE"."cycletime" < -30 THEN '-45 - -30'
WHEN "TABLE"."cycletime" < -15 THEN '-30 - -15'
WHEN "TABLE"."cycletime" < 0 THEN '-15 - 0'
WHEN "TABLE"."cycletime" < 1 THEN '0'
WHEN "TABLE"."cycletime" < 9 THEN '1 - 9'
WHEN "TABLE"."cycletime" < 29 THEN '9 - 29'
WHEN "TABLE"."cycletime" < 59 THEN '29 - 59'
ELSE '≥ 59'
END
Question 1: Is there an equivalent to the old "Explicit boundaries" feature in the new Celonis Studio Views (e.g., via Visual Editor or YAML/JSON configuration) to bind numeric intervals directly within the component configuration?
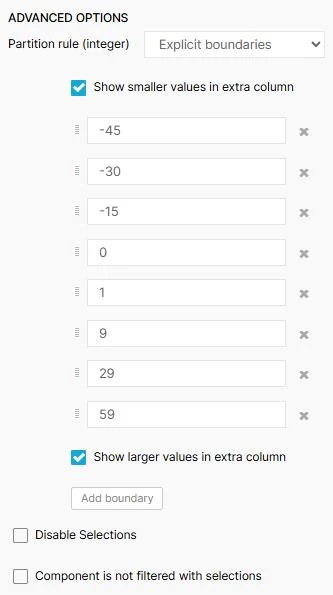
Question 2: If there is no direct UI equivalent: How can we force all defined interval categories to be rendered on the X-axis in Views, even when the metric evaluates to 0 or NULL (e.g., by overriding automatic NULL stripping)?
Question 3: What is the best practice in Celonis Views for sorting custom text categories logically/numerically on the X-axis without having to prefix the label text with leading numbers (like 1., 2.)?
Note: We would prefer not to resolve this issue on the backend side (Data Model transformations). Are there purely frontend-based alternatives available?