 Hello Team,
I have query and have attached a picture of it in this Topic.
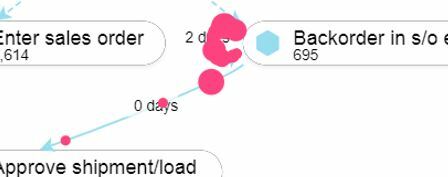
While running simulation, I have observed that the beads move from one activity to another but have different sizes.
Can you please tell me what does the different sizes of the beads technically/functionally mean(image attached). I was assuming that the size of the beads should be uniform as it indicates individual cases. Please correct me if Im wrong.Thank You.
Warm Regards,
Jayanta
Hello Team,
I have query and have attached a picture of it in this Topic.
While running simulation, I have observed that the beads move from one activity to another but have different sizes.
Can you please tell me what does the different sizes of the beads technically/functionally mean(image attached). I was assuming that the size of the beads should be uniform as it indicates individual cases. Please correct me if Im wrong.Thank You.
Warm Regards,
Jayanta
Question
Size of Beads in Simulation while moving from one Activity Node to another
Hello Team,
I have query and have attached a picture of it in this Topic.
While running simulation, I have observed that the beads move from one activity to another but have different sizes.
Can you please tell me what does the different sizes of the beads technically/functionally mean(image attached). I was assuming that the size of the beads should be uniform as it indicates individual cases. Please correct me if Im wrong.Thank You.
Warm Regards,
JayantaLogin to the community
No account yet? Create an account
Login with SSO
Celonaut Login Celonis ID LoginEnter your E-mail address. We'll send you an e-mail with instructions to reset your password.