Hi, I am trying to show the number of cases devided by variants of process using following dimension and KPIs.
Dimension
DISTINCT (VARIANT("_CEL_MM_ACTIVITIES"."ACTIVITY_JA"))
ACTIVITY_JA contains the name of activities
KPIs
COUNT_TABLE("_CEL_MM_ACTIVITIES_CASES")
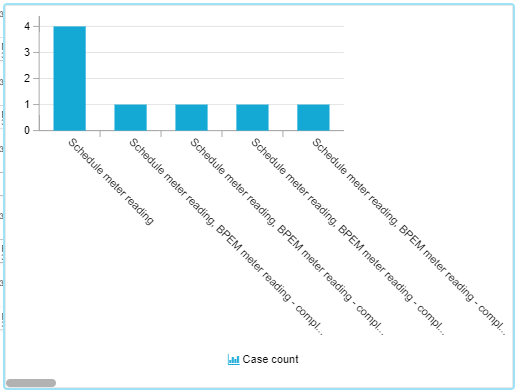
Only the Bar Chart is refused to show the result showing following error. OLAP and other types of graphics elements show successfully what I want.

I believe the code is pretty simple, I cannot understand why the code does not work only in the Bar Chart.
I have tried following things already, fyi;
- writing without DISTINCT
- writing with SHORTEND
- counting other things e.g. ACTIVITIES
Please let me know should you require additional information concerning this issue.
Best

 Best
Best