 However, I am too stupid to write the function for this - I would appreciate any help how to get to this result.
Have a great day and weekend!
However, I am too stupid to write the function for this - I would appreciate any help how to get to this result.
Have a great day and weekend!
Question
Custom Process Connection and Activity KPI
Dear Celonis-Team,
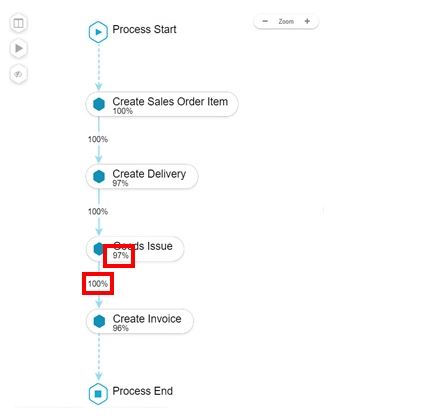
I want to visualize the percentages of Process Connections instead of their absolute values.
See the picture below:
However, I am too stupid to write the function for this - I would appreciate any help how to get to this result.
Have a great day and weekend!
However, I am too stupid to write the function for this - I would appreciate any help how to get to this result.
Have a great day and weekend! It is more about how the process explorer works and how it visualizes the connections. The connection is 100% because all of these cases who take this path are directly connected to the activity.
For further support, can you please provide the PQL script that you are currently using?
Best regards,
Viana
It is more about how the process explorer works and how it visualizes the connections. The connection is 100% because all of these cases who take this path are directly connected to the activity.
For further support, can you please provide the PQL script that you are currently using?
Best regards,
Viana Currently I am working with this formula within the process explorer KPI:
COUNT_TABLE(EKPO) / GLOBAL(COUNT_TABLE(EKPO))
However, this is calculating the % of the global case counts and not from the preceding or subsequent activity respectively.
My goal is to have use the case frequency of each activity and calculate the % of connections to all other subsequent activities.
In the picture above, assume 60% flow from Create Sales Order Item to Create Delivery and other 20% flow to Goods Issue and the rest 20% flow to the end. How can I get the % values of each connection and not their absolute values?
I hope you understand my problem.
All the best
Currently I am working with this formula within the process explorer KPI:
COUNT_TABLE(EKPO) / GLOBAL(COUNT_TABLE(EKPO))
However, this is calculating the % of the global case counts and not from the preceding or subsequent activity respectively.
My goal is to have use the case frequency of each activity and calculate the % of connections to all other subsequent activities.
In the picture above, assume 60% flow from Create Sales Order Item to Create Delivery and other 20% flow to Goods Issue and the rest 20% flow to the end. How can I get the % values of each connection and not their absolute values?
I hope you understand my problem.
All the bestLogin to the community
No account yet? Create an account
Login with SSO
Celonaut Login Celonis ID LoginEnter your E-mail address. We'll send you an e-mail with instructions to reset your password.