Question

Celonis cascading dropdown: bar chart doesn’t refresh when one of two dropdown changes

  • March 12, 2026
  • 2 replies
  • 61 views

kenjoeyamane
Level 2
Forum|alt.badge.img

I’m encountering a refresh/dependency issue with a cascading dropdown setup in Celonis Studio.


I have a bar chart histogram where the user selects:

  1. Dropdown #1 (Date field): “Ordered Date” or “Submit Date”

  2. Dropdown #2 (Time interval): Days / Weeks / Months / Quarter / Years

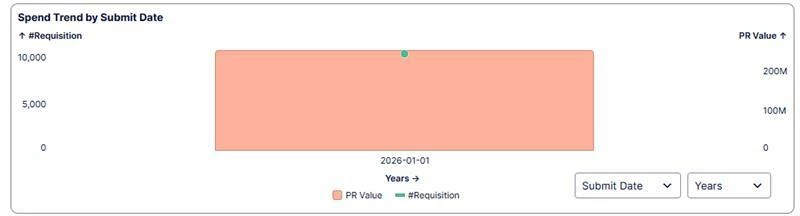
  3. The Bar Chart buckets the selected date field by the selected interval.

Current logic / dependency chain:

  1. Dropdown #1 stores the selected date column PQL into: ai_purchase_analysis_histogram_dd
  2. Dropdown #2 is a dependent control: It uses ${ai_purchase_analysis_histogram_dd.pql} for its data. It stores the PQL into: graphtimeinterval
  3. Bar chart dimension uses: ${graphtimeinterval.pql}

The issue

The chart updates when:

  1. I change Dropdown #1 then Dropdown #2
  2. I chagne dropdown 2 only

But the chart does NOT update when:

I change Dropdown #1 only (Ordered Date ↔ Submit Date)

So it seems the chart only refreshes when graphtimeinterval changes, not when the upstream dropdown (ai_purchase_analysis_histogram_dd) changes, even though Dropdown #2 references it.

2 replies

kenjoeyamane
Level 2
Forum|alt.badge.img
  • Author
  • Level 2
  • March 16, 2026

Here’s a screenshot of the graph


manuel.wetze
Level 10
Forum|alt.badge.img+8

Hi there,
I haven’t recreated your problem but it seems like indeed the barchart is not recognizing that the variable calculation changed. Maybe changing with dropdown 1 only sets the input variables of dropdown 2 but not the variable which is written to by dropdown 2. 
Maybe there is a setup problem there how you are accessing the variables and you can find a more elegant solution.

One idea how to circument the issue though which will work is to not use one variable within another but only combine both in your barchart.

You keep the first dropdown to what it right now (object type)
The second one you can change to a simple string value instead an object. 
Then the Field in the bar chart you can do a 

CASE WHEN ${graphtimeinterval}=’ YEARS’ THEN ROUND_YEARS(${ai_purchase_analysis_histogram_dd.pql}
           WHEN graphtimeinterval =’ WEEKS’ THEN ROUND_WEEKS(${ai_purchase_analysis_histogram_dd.pql}

END…..