Question

Add Chart Layers and Context in Views Example

  • March 16, 2023
  • 1 reply
  • 2 views

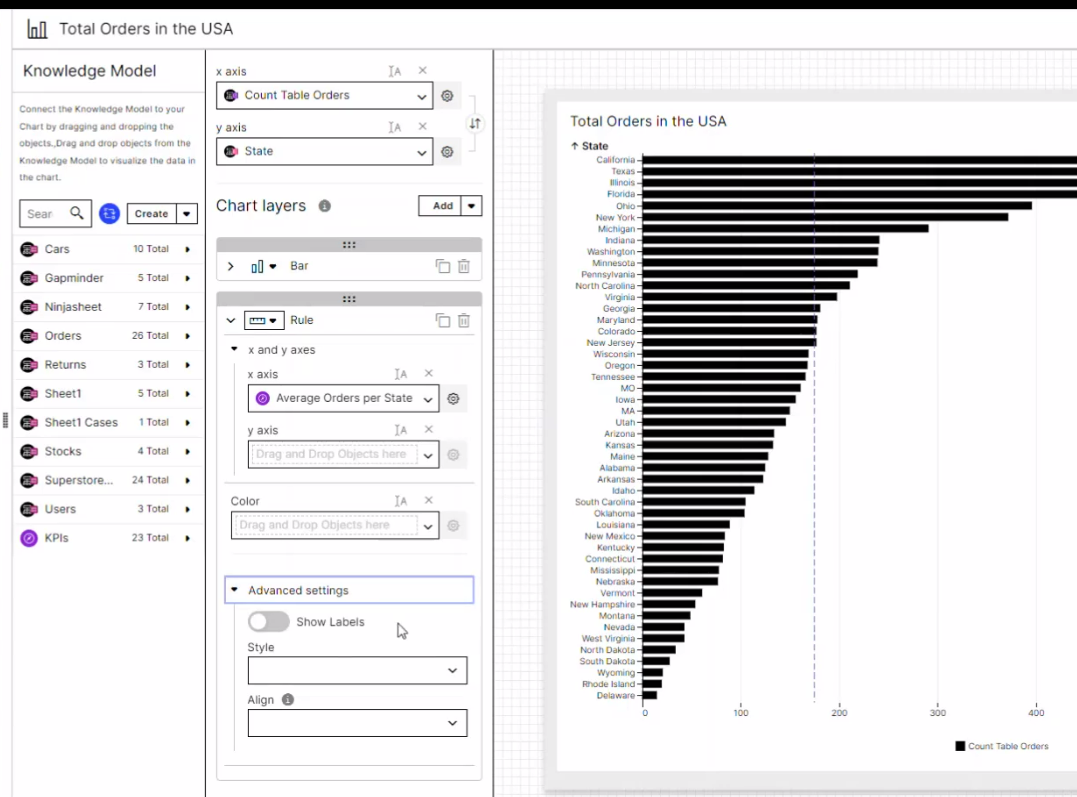
In the training "Add Chart Layers and Context in Views Example" they use the rule mark to add "average of sales by state". I am looking to do the same in one of my views. I would like to be able to add the Median of a KPI to a chart of mine.


What does the PQL for this KPI in the example look like? I get errors of nested aggregation when I try to take the median of my KPI.


From Training

1 reply

May have answered my own question here, but I was able to make an Average dashed rule by putting kpi1/ COUNT (DISTINCT kpi2) where kpi1 is the # of orders like the example above, and kpi2 is the category I wanted an average by. Would still prefer median, but don't see how to do it without errors.