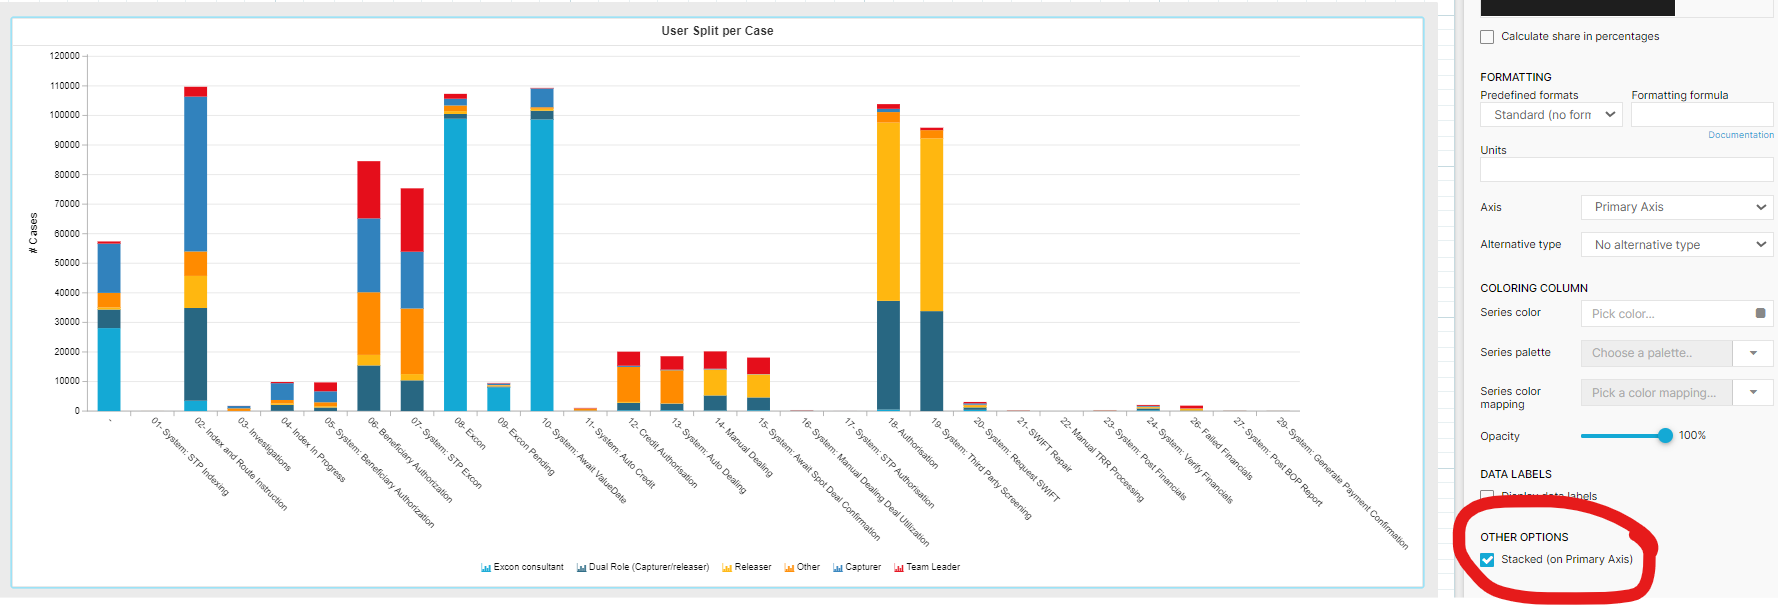
I would like to stack bar graphs on top of each other like this - I see there is an option to "Stacked (on Primary Axis)":
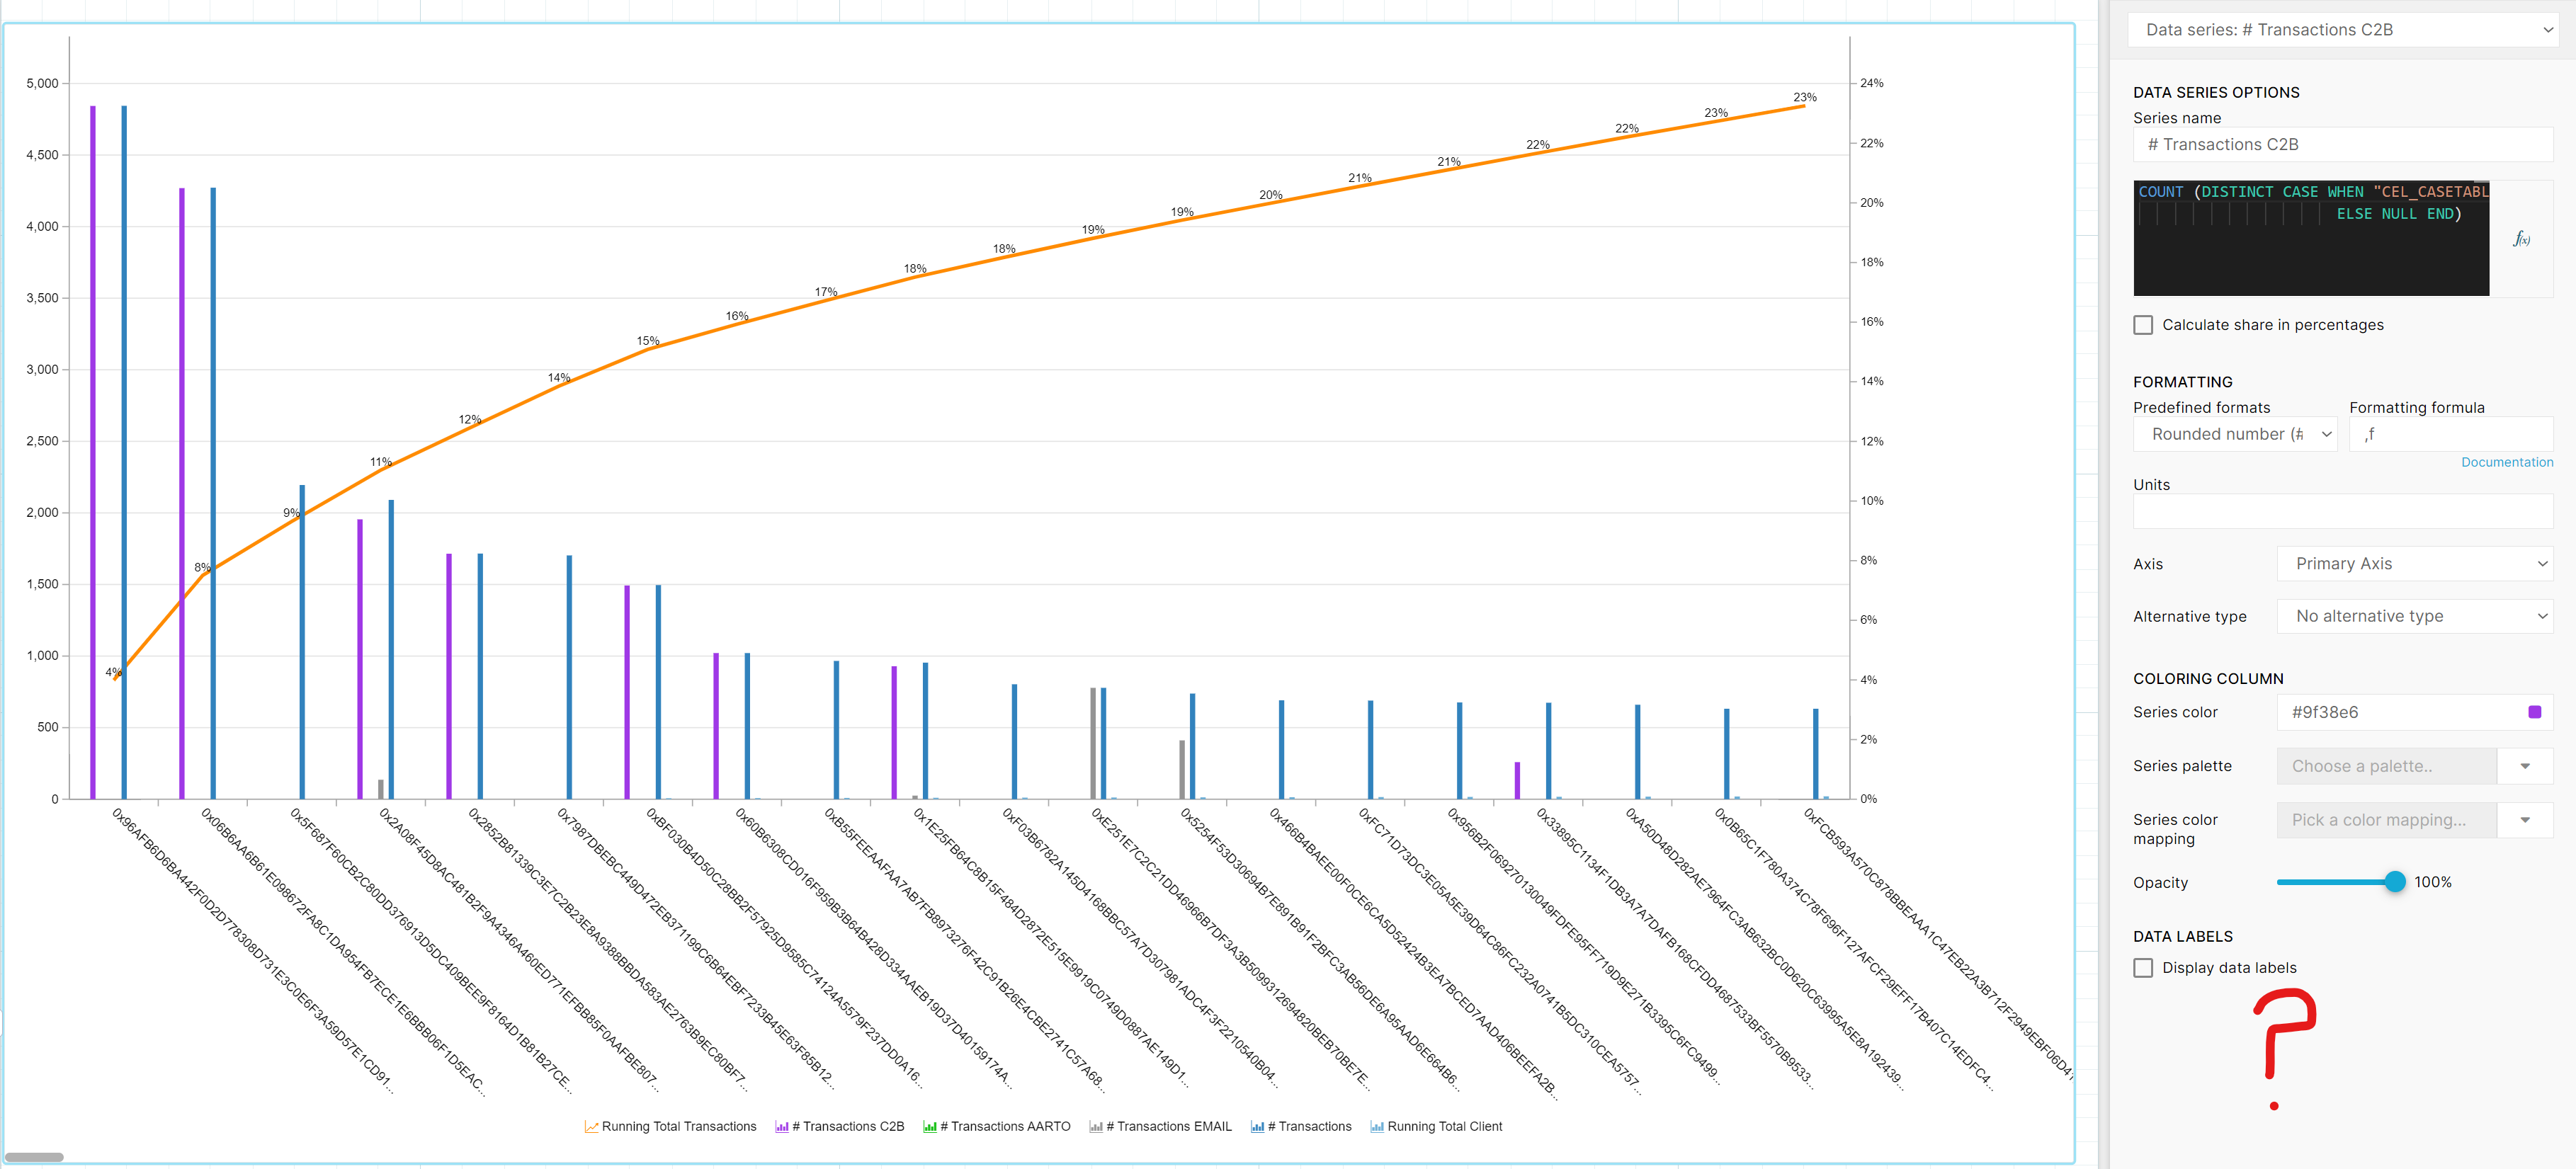
 But it looks like when I add a secondary axis that option disappears -
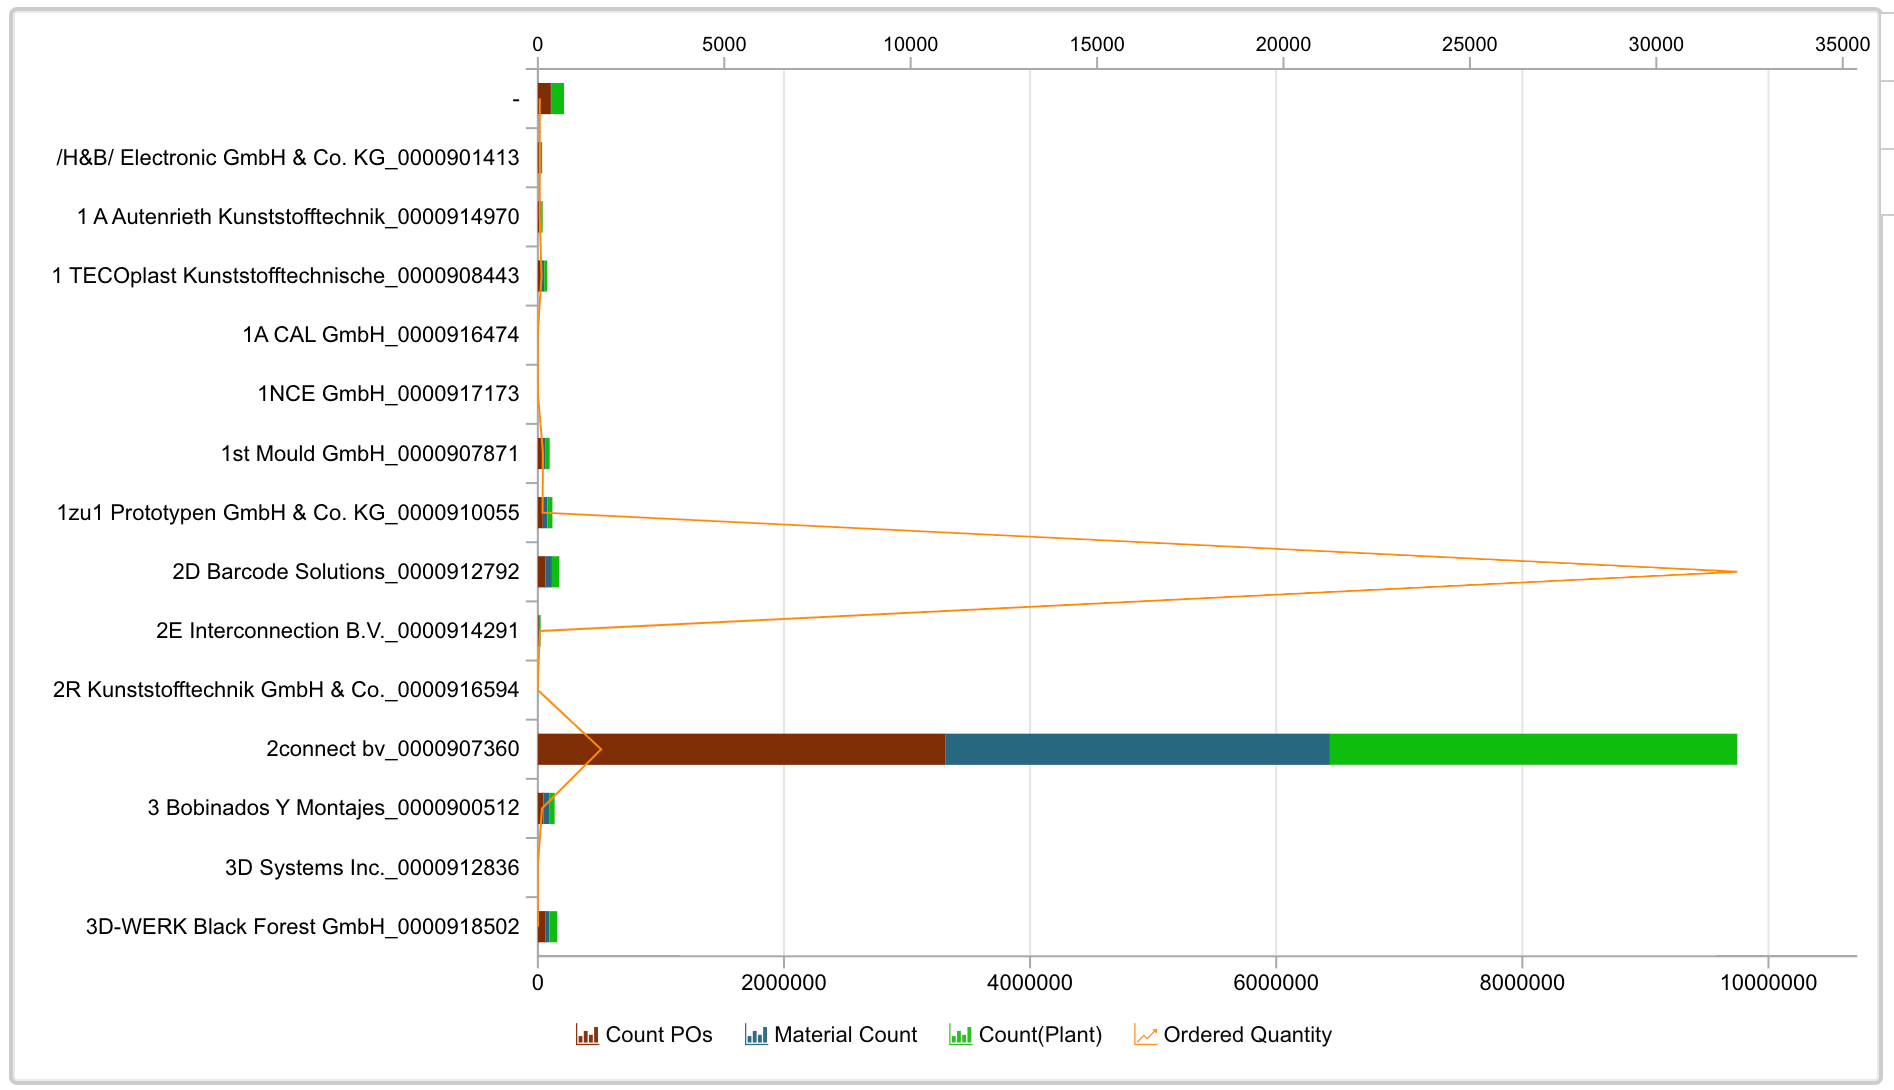
 Does that mean it is not possible in Analysis to combine a stacked bar graph with a line graph on the secondary axis? Or is there a way to combine a stacked bar chart on the primary axis with a line chart on the secondary axis?