Question

SoryBy is changing the values!

  • Jan 11, 2024 12:58 PM UTC
  • 4 replies
  • 114 views

itay.tarab
Level 3
Forum|alt.badge.img

Hi All,


We are trying to analyze IT project approvals in the organization.

Our internal customer asked us to order the columns based on the duration time.

We did it by adding "SortBy" to the YAML configuration of the bar charts,

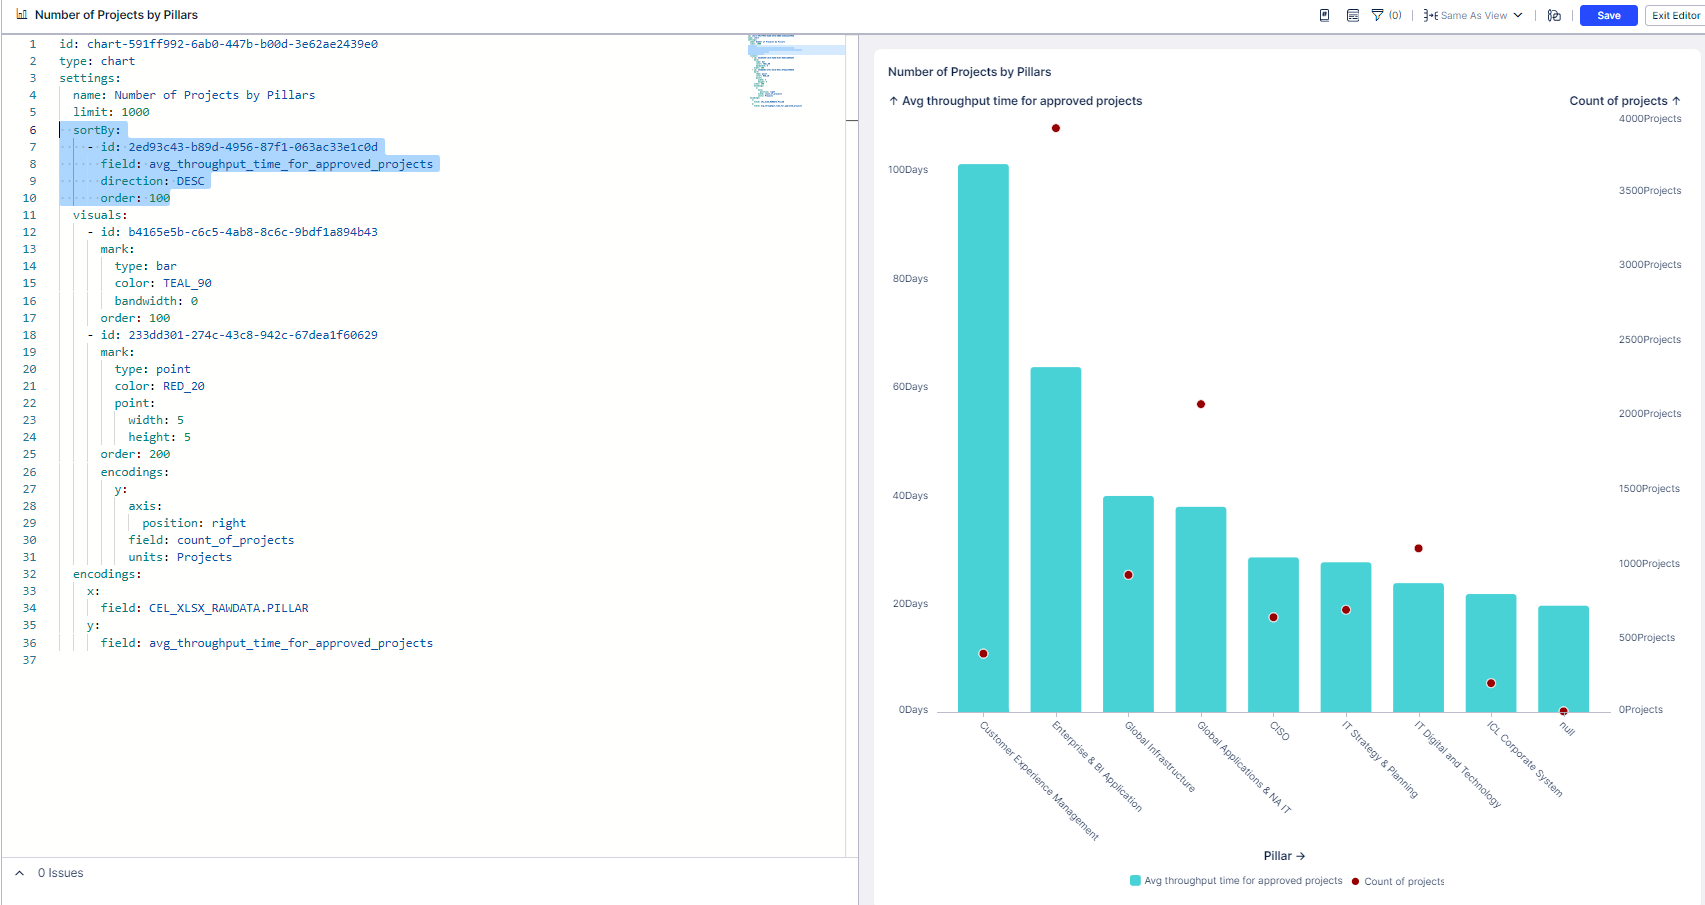
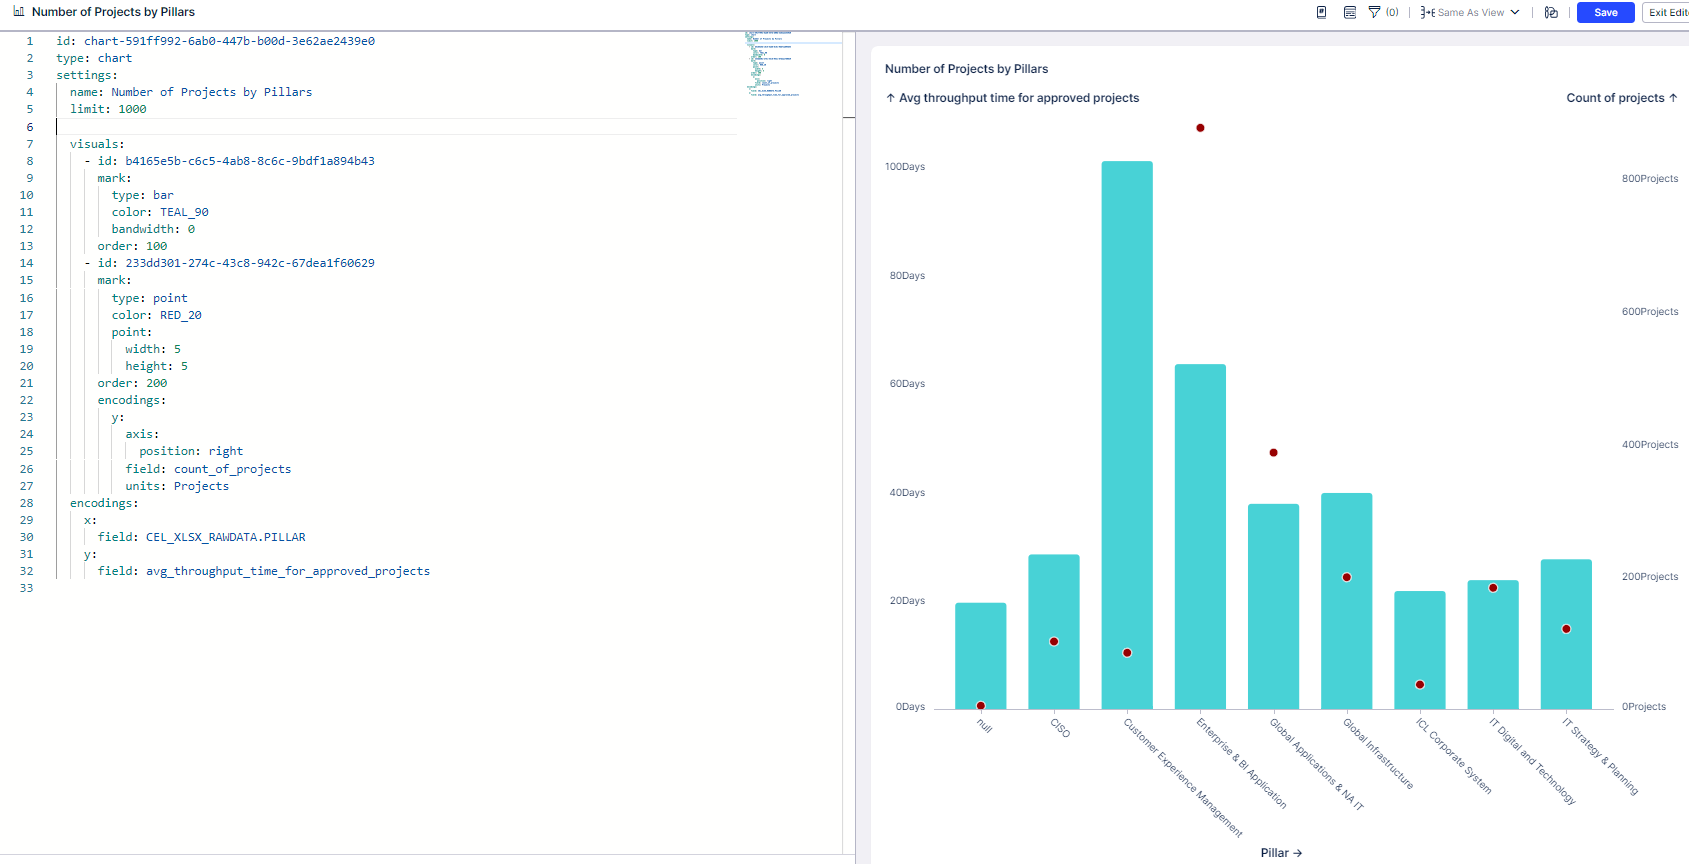
Once done, the values of the number of project (second layer of 'Points') are increased.

Can someone explain me the reason? How can it be resolved?

Adding images before and after the change:


Before:
image 

After:

image 

Count of projects increased to 4000 from 800. Values also increased.


*Change marked in blue.


Best regards,

4 replies

  • Jan 11, 2024 3:55 PM UTC

Hi Itay,


I think something in the PQL formula(s) is causing the duplication/increase. Not sure what it is but I would suggest searching there!


  • Jan 11, 2024 7:55 PM UTC

One thought is your result set greater than 1000 rows? If so, by sorting you are getting only the largest 1000 data points skewing upward rather than averaging an unsorted set.


itay.tarab
Level 3
Forum|alt.badge.img
  • Author
  • Level 3
  • Jan 14, 2024 6:59 AM UTC

Hi Itay,


I think something in the PQL formula(s) is causing the duplication/increase. Not sure what it is but I would suggest searching there!

Bar -

X axis PQL:

"_Cel_Xlsx_RawData"."Pillar"

Y axis PQL:

AVG( CALC_THROUGHPUT (

   FIRST_OCCURRENCE ['Pending Idea'] TO LAST_OCCURRENCE ['Approved'] ,

    REMAP_TIMESTAMPS ( "_CEL_XLSX_ACTIVITIES"."Date" , DAYS,

     WEEKDAY_CALENDAR ( SUNDAY MONDAY THURSDAY WEDNESDAY THURSDAY) ) ) )

Point-

Y axis PQL:

COUNT ( "_CEL_XLSX_RawData"."JOINED ID" ) ---count of projects.


The weird thing here, is that when i'm changing the sorting statement on YAML editor to sort by the "count of projects" KPI, the numbers are good.

Happens only when sorting by the "Avg throughput time for approved projects" (Y axis PQL on the Bar chart layer - the first layer)


itay.tarab
Level 3
Forum|alt.badge.img
  • Author
  • Level 3
  • Jan 14, 2024 7:01 AM UTC

One thought is your result set greater than 1000 rows? If so, by sorting you are getting only the largest 1000 data points skewing upward rather than averaging an unsorted set.

Its not make sense to me due to the value of the "count of projects" KPI. there are 1996 projects overall, so I can't see how it is connects to the increase of values.

But thank you for you answer.