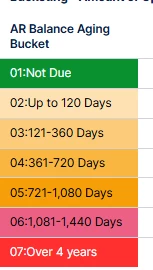
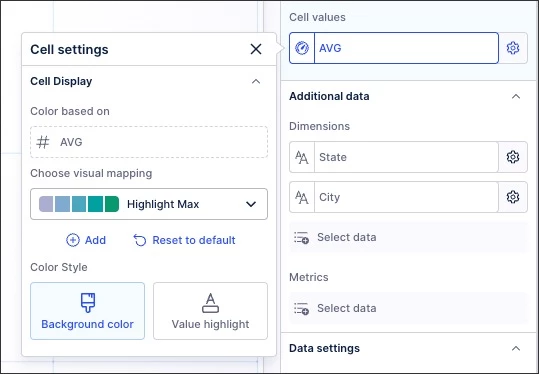
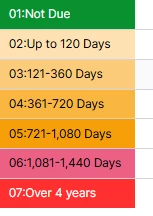
Could you help me to advise on how to classify the bucketing with the help of coloring in pivot table which is recently develop in new view. We are able to provide the color classification in Olap Table however i am afraid it is not yet possible in pivot table.
Please Help
Regards,
Apurva
Page 1 / 1
In a pivot table, you can change the color of cells based on the values they show. You can use color gradients or set color thresholds to highlight important numbers. The color can either fill the whole cell or just highlight the number inside it—similar to how it works in a regular table.
I tried the way you suggested me. However in mentioned above settings we can only classify the color with minimum, maximum and median values. For the post i have created, in that scenario, I am trying to classify it for more than 3 values. You can refer below image again. With the help of above setting you advised, is not giving the result as expected.