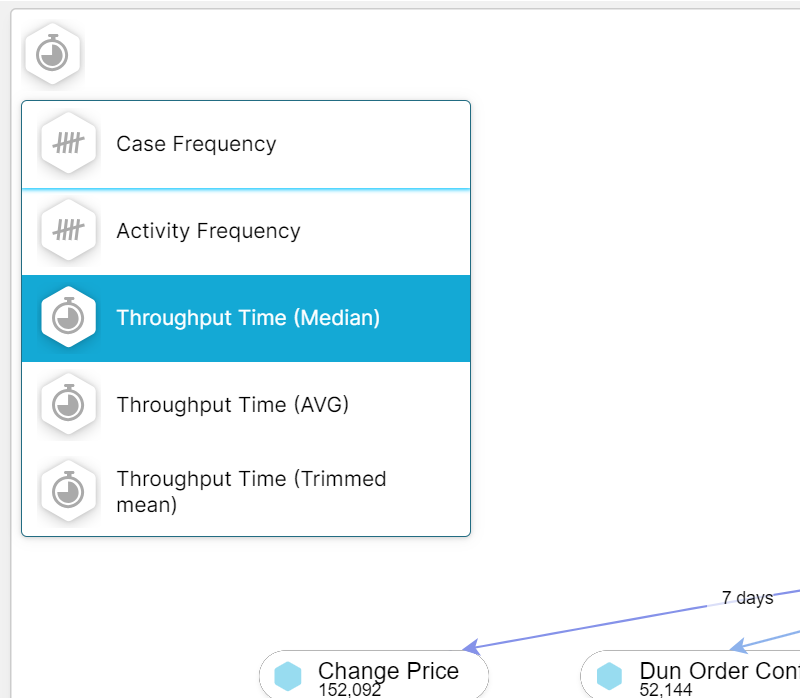
I can count the connections or display an average but not display the total wait time for the entire cases. I can have a huge average but the total number of connections might be very small, or the opposite. So I'd like to see them combined (multiplied) to have an overall view. How do I do that ?
Thanks for your posting.
The variant explorer (also process explorer) only has options to display the median, average, and trimmed mean for connections between activities as you already noticed.
Please open a feature request if you need enhancement of these components
Or, please open a support ticket to ensure whether there is an alternative method.
Thanks for your understanding.
If you are using analyses, you can easily add additional Process Explorer KPIs (see: Process Explorer KPIs (celonis.com)).
If you are using Views, I do not see any option to achieve this. The Process Explorer docs mention that you can also select custom KPIs, but you cannot specify these in the Event Log tab in the knowledge model, so this seems to not be implemented (yet), see Process Explorer (celonis.com).
I hope this helps!
Reply
Enter your E-mail address. We'll send you an e-mail with instructions to reset your password.