Question

Is there any way to have more 'Charts & Tables' components when performing an analysis?

  • March 21, 2023
  • 2 replies
  • 9 views

Hi,


I have the fields which I'd like to visualize. These fields are:


  1. Source country (e.g. Spain)
  2. Destination country (e.g. Italy)
  3. Number of cases (e.g. 5)


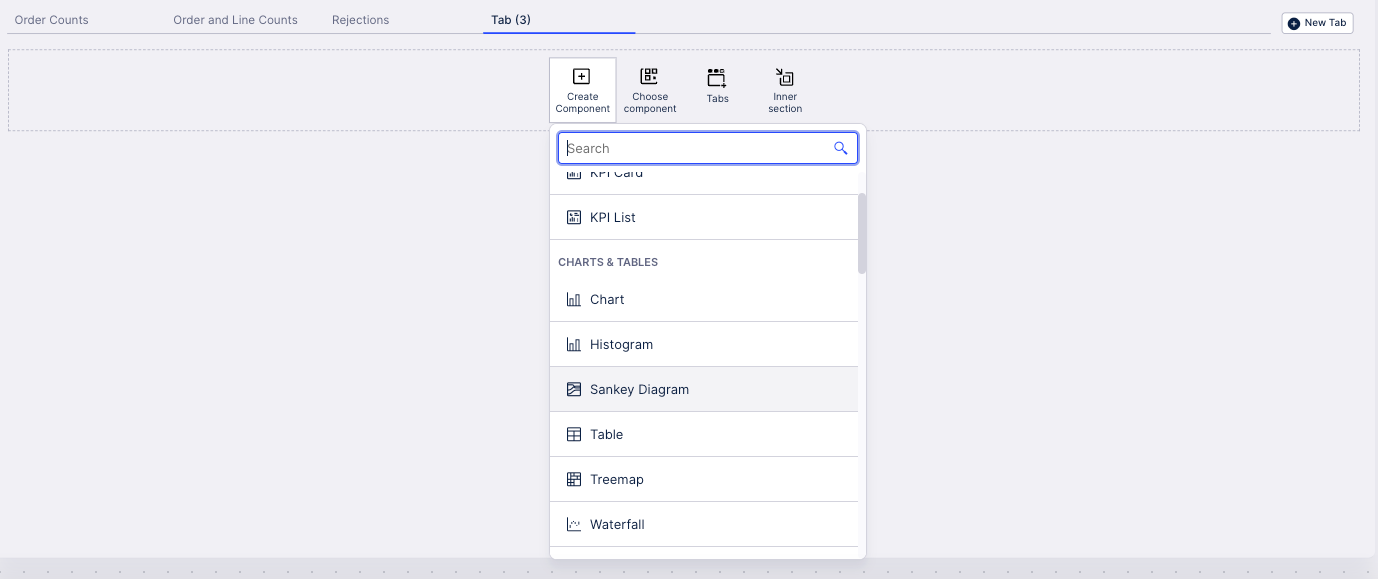
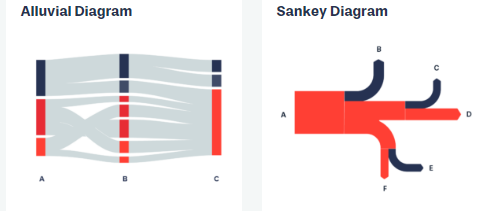
Ideally, I'd like to use an alluvian or sankey diagram. A map showing all flows would work as well. Is ther any way to have these when working with analysis?


image 

Thanks in advance

2 replies

muthappan.alaga
Level 8
Forum|alt.badge.img+1

Hi Xavi,


Sankey diagram chart is possible in Views but not in analysis. Try views.


image 

Thanks

Muthappan


  • Author
  • Level 2
  • 2 replies
  • March 21, 2023

Hi Xavi,


Sankey diagram chart is possible in Views but not in analysis. Try views.


image 

Thanks

Muthappan

Yes, I saw it. However, I find it quite strange to have it in Views but not in analysis. Is there any reason for this?