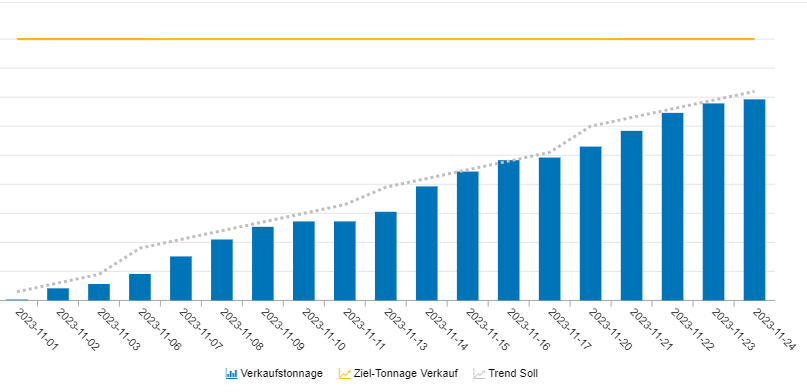
Is it possible to show a complete year on the x axis, even if the timestamp column of the table does not contain all the data? For example: I would like to show the cumulative sales tonnage and thus show a trend. However, the axis naturally stop
Question
Is it possible to show a complete year on the x axis, even if the timestamp column of the table does not contain all the data? For example: I would like to show the cumulative sales tonnage and thus show a trend. However, the axis naturally stop
I would try create a KPI with all the date you want represent. I don´t know if this helps you
Thanks Samuel. Do you have a tip with which formula I could get the result. I need to add days to my last cration date until end of every month. Right now I have no idea how to do so.
Thanks Samuel. Do you have a tip with which formula I could get the result. I need to add days to my last cration date until end of every month. Right now I have no idea how to do so.
I, am thinking that maybe it´s nos posible make i said before. I would try instead add emty rows with only the days that you need to your data. Maybe you can do it using a transformation. Sorry if i don't help you enought, I am not a expert.
Thanks Samuel. Do you have a tip with which formula I could get the result. I need to add days to my last cration date until end of every month. Right now I have no idea how to do so.
I think this time I really found what you need. Check this: