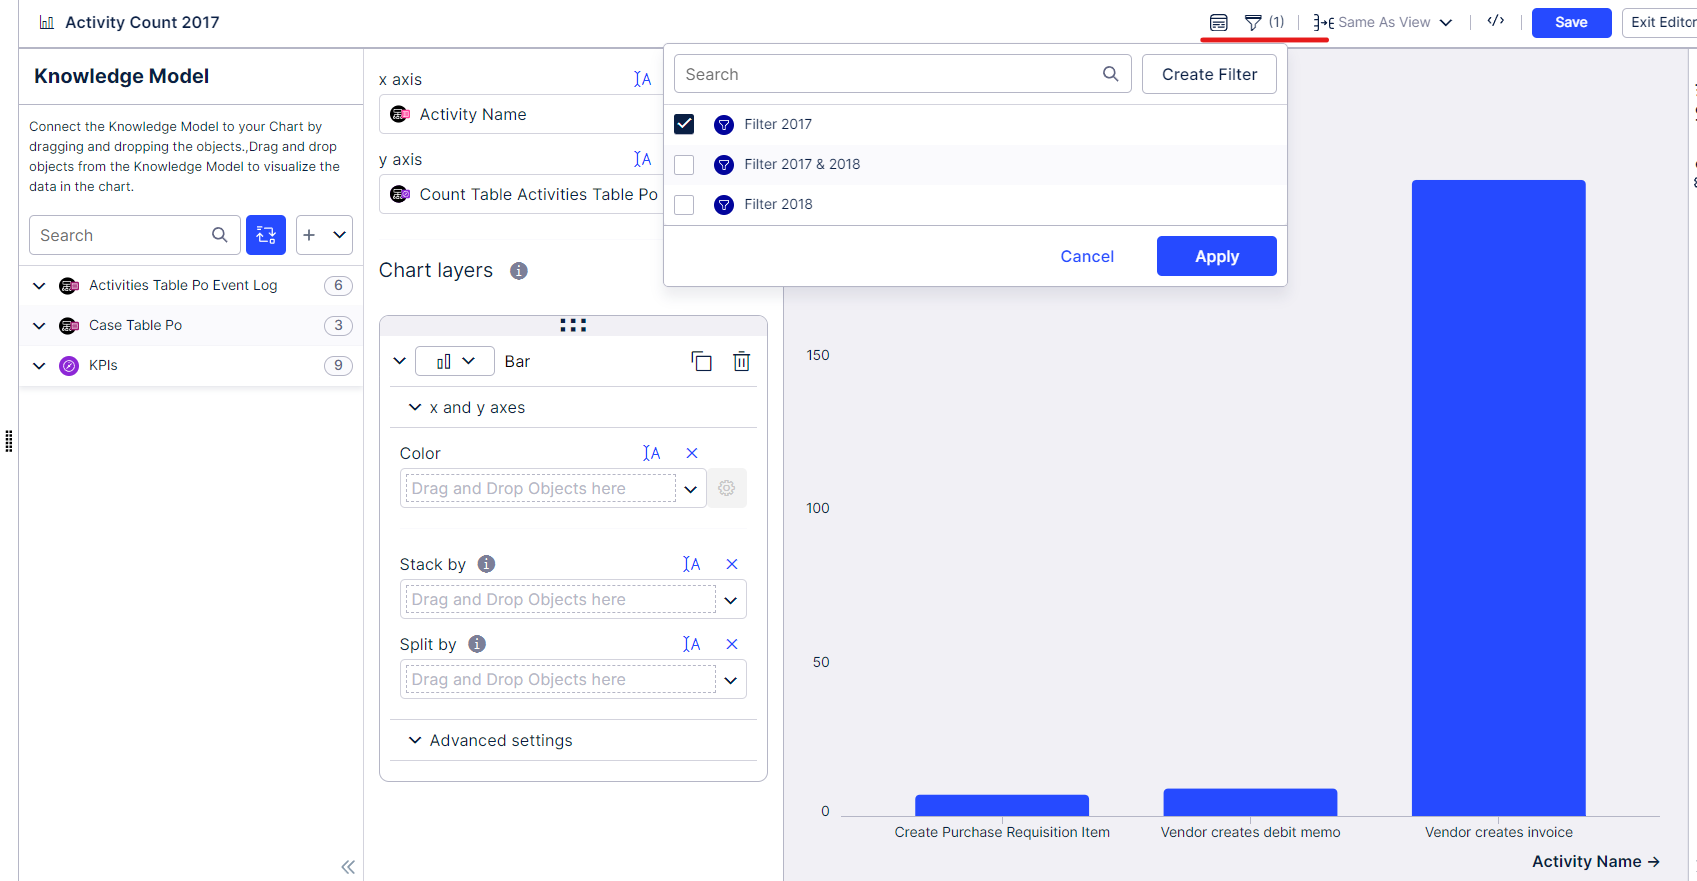
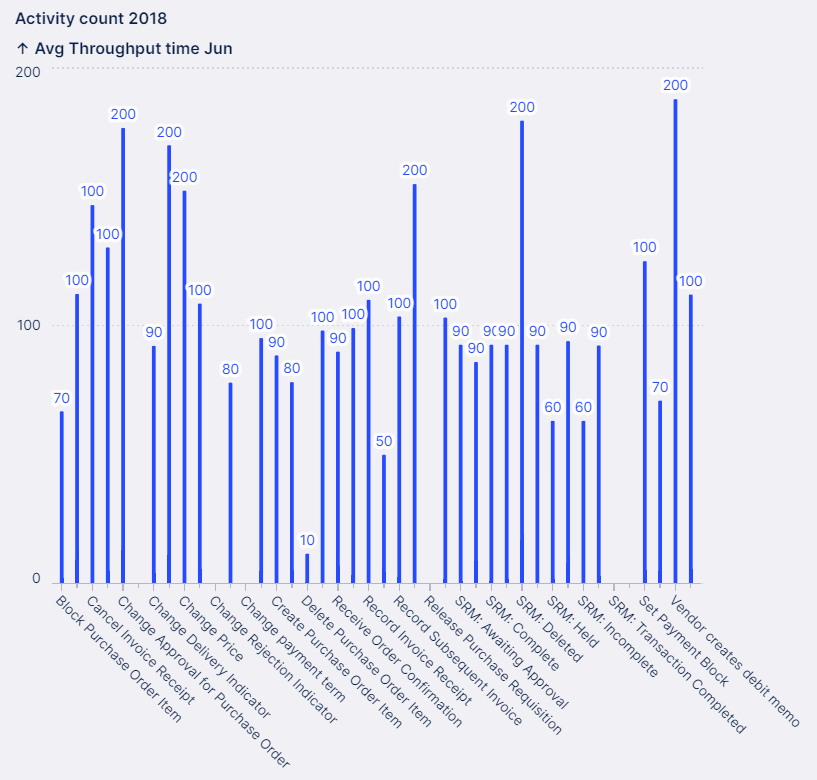
You can then apply these filters to two identifical tables for comparison.
For instance, in the image below I applied the 2017 filter. In another table, you can then do the Filter for 2018. In your case of coure, it would be 2023 and 2024
Terribly sorry for the late response, I have been quite busy.
Thanks for the referential screenshot. I created something similar, but I need more information to replicate what you have shown me. For instance,
I do not know what the green numbers are exactly.
What is present on the Y-axis?
If I have more info on the two bullet points above, I can help you further.
Let me know if the below is something like what you are currently looking for, then we can work it out together. 😎
* I do not know what the green numbers are exactly.
Green numbers are representing how much data has been increased from previous year and red colour indicate how much it has been decreased from previous year.
* What is present on Y-axis?
Numbers of the current year and difference between current – previous year
Regards,
Apurva Pathak
Senior Consultant-Celonis
Fresenius Kabi India Pvt. Ltd.