

Context:
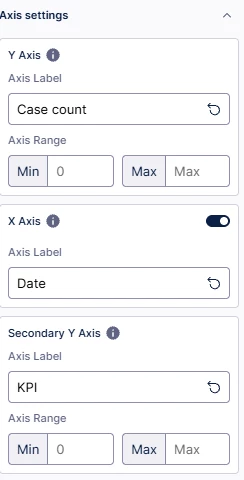
I am creating a View in Studio, where I have a bar and line component that shows case count on the Y axis as bars and a KPI on the Y2 axis (range 0-1) as a line. Rounded dates are shown on the X axis. I also have an annotation line on the Y2 axis with labels shown.
The component is partly filtered by using View variables.
Issue:
I can’t get the Y2 axis range to change according to the shown values and it keeps bounding the lowest value of KPI to zero and maximum to the maximum of KPI (or annotation line if higher). However, I’d like to show the plot based on the minimum values of KPI, since readability becomes poor when values are closer to the maximum of 1.
The Y2 axis range updates dynamically, when I don’t have labels shown for Y2 axis and temporarily set the minimum to 0 and unselect the component. The labels for Y axis or annotation lines or showing points of the KPI do not affect the axis range of Y2. It seems like showing the Y2 point labels prevents the range to update dynamically to nonzero minimum.
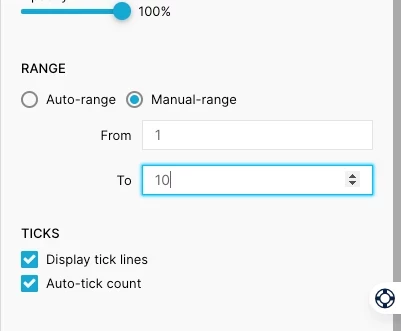
Why is there no “Auto-range” option as presented in this post (below image)?
Current solution:
I have tried to modify the component’s YAML to set “zeroBased” to false on the y axis encodings without results. A user-set variable works, but this is bad for usability when the Y2 axis range is not dynamically. Also, the annotation labels are required.
Setting the Y2 axis minimum to zero and unselecting the component works for both YAML modified and unmodified components, but showing the labels break this.