Question

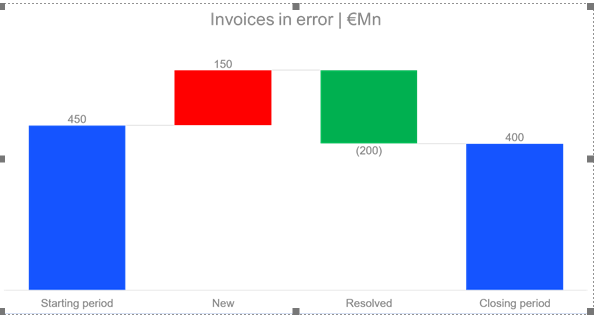
Can we construct a Waterfall Chart with the defective invoices were it shows the number of defective invoices in the start of the period, the new defective invoices, the resolved ones and the number of defective invoices in the end of the period

  • April 8, 2024
  • 1 reply
  • 9 views

Forum|alt.badge.img

Something like this:


image

1 reply

Forum|alt.badge.img+8

Hi Joao,


Yes, it is possible to create a vertical waterfall chart in celonis. You can try using the following in YAML to build the waterfall chart :


- id: waterfallChartVertical

 type: waterfall

 settings:

    name: Vertical Waterfall Chart

    orientation: vertical

    kpis:

   - kpi: Starting Period of Defective Invoices# required, add the id of a KPI here

color: BLUE_40 # optional, possible color options can be found below

   - kpi: New Defective Invoices

    color: RED_10

   - kpi: Resolved Defective Invoices

    color: GREEN

  - kpi: Defective Invoices during Closing period

    color: BLUE_40

    subparts: # optional, define sub-level KPIs

     - kpi:

      color: 


For additional information, you can refer to our documentation here.


Hope this helps, please let me know if any additional information is required.


Best,

Riddhi