

Hello!
I am looking at the documentation for Column Charts in Views and cannot find any YAML code that shows me how to plot different KPIs side by side to each other (each in a different column) and not stacked onto each other.
Does anybody know how the YAML code for it would look like? Just 2 different KPIs under the same dimension X value.
Thank you very much!
Javier


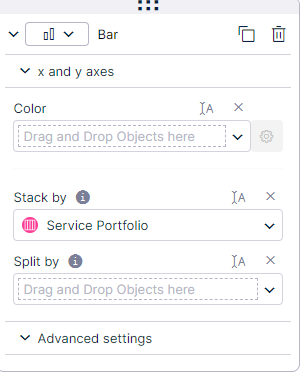 Add the x axis column in the split by field to get a side by side look.
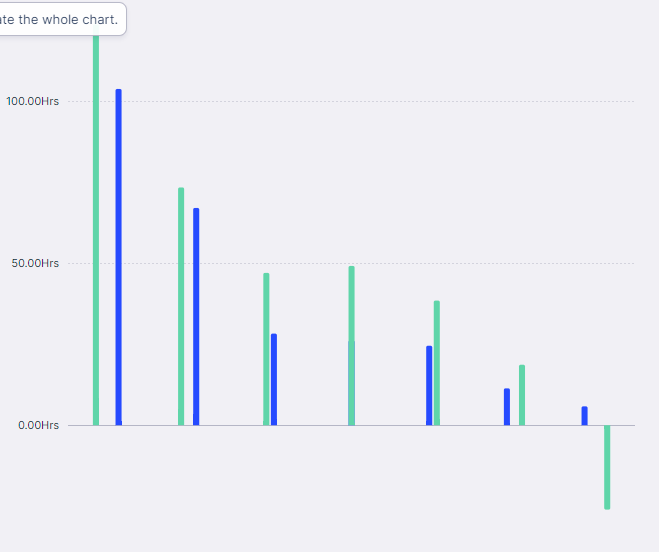 Only issue with it which I am facing is the alignment of the second bars are inconsistent. If any solutions available please help out