Hello Team,


I wanted to monitor few data pools and I have already enabled "Custom Monitoring". I wanted to build some KPIs and analysis on daily APC usage. Can I get to know more details on how I can build the KPIs and analyses? I kindly request some more detailed information on this topic "Custom Data Pipeline Monitoring". I have already went through the help page on Celonis. However still need some more information.


Best Regards,

Aditya

Hi Aditya,


You should be able to download pre-built Analyses for Data Pipeline Monitoring, directly from the EMS Store.

Maybe you already went through this link, but just in case the Full documentation is here (just login to your team through this link).

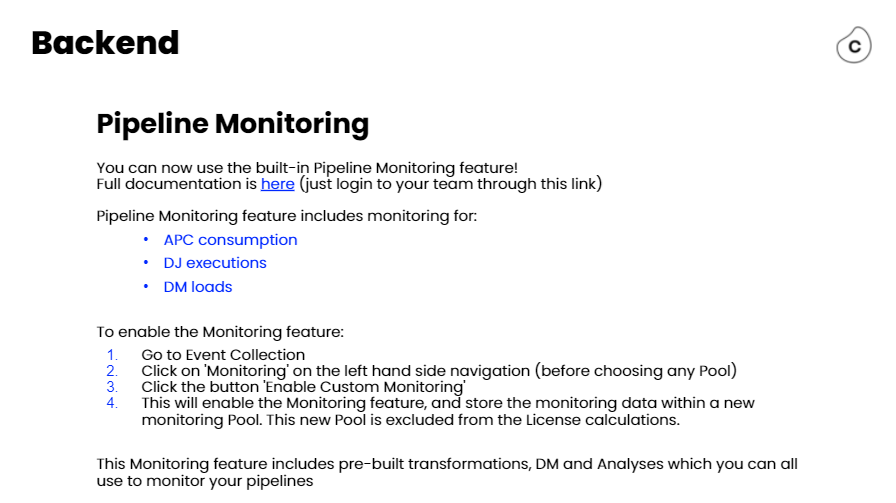
Below is a high-level summary of the feature if it helps too:


Pipeline Monitoring summary 

Best,

Hello Stephane,


Thank you for you answer, however the link which you have provided is not accessible to me via my training account.

imageI have a couple of points more to discuss related to the same topic:

  1. In 'Monitoring Pool' for 'data pipeline monitoring', one of the global transformations, we are not able to execute 'Data Model Executions' job as 'data_model_load_events' doesn't exist in the schema.
  2. Process Data Model load for 'Data Pipeline Monitoring' is failing because of issue below:

imageIs there a way to resolve these issues?


Best Regards,

Aditya


Hi Aditya,


You should be able to download pre-built Analyses for Data Pipeline Monitoring, directly from the EMS Store.

Maybe you already went through this link, but just in case the Full documentation is here (just login to your team through this link).

Below is a high-level summary of the feature if it helps too:


Pipeline Monitoring summary 

Best,

Hello Stephane,


I was able to open the link now. It is the same link which I went through. Could you please guide me a little more on the queries above? Thanking in advance.


Best Regards,

Aditya


Hello Adi,


Probably Training environment won't have all the required features. Go to a sandbox or uat instance to test it.

image

  1. Within the environment click on EMS Store (Top Right).
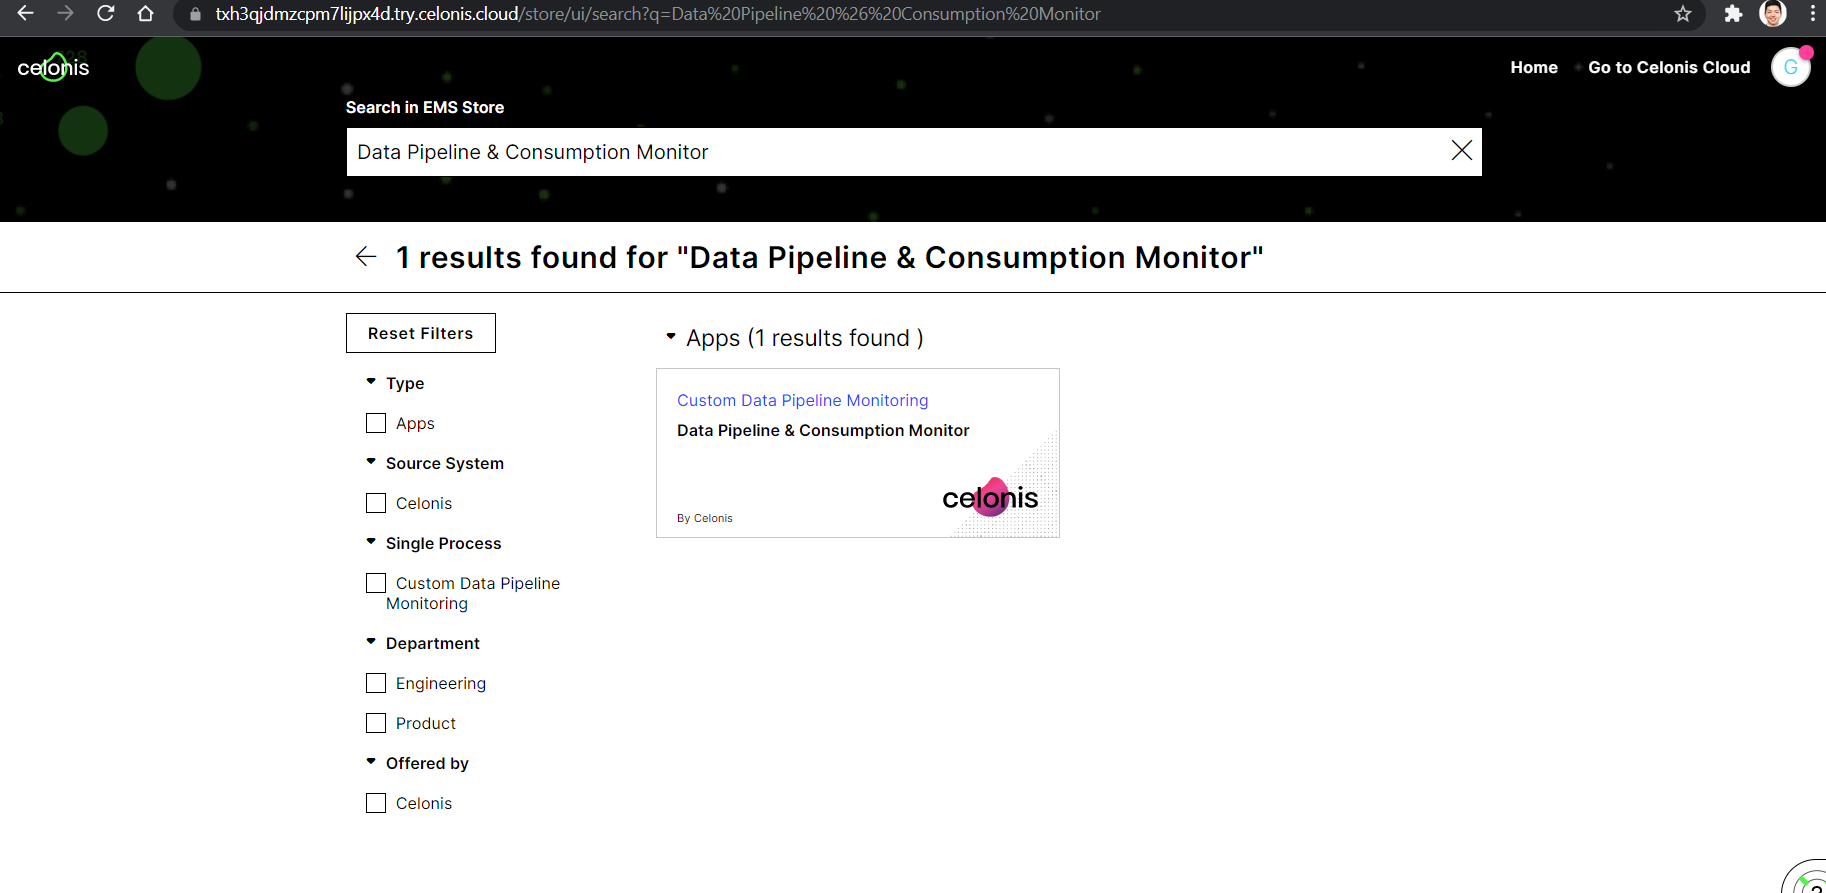
  2. Search for the App Data Pipeline & Consumption Monitor (see image)
  3. Once installed, the package will contain the analysis in Studio and the DM in Event Collection
  4. Make sure that under Event Collection , Custom Monitoring is enabled (see image)

image

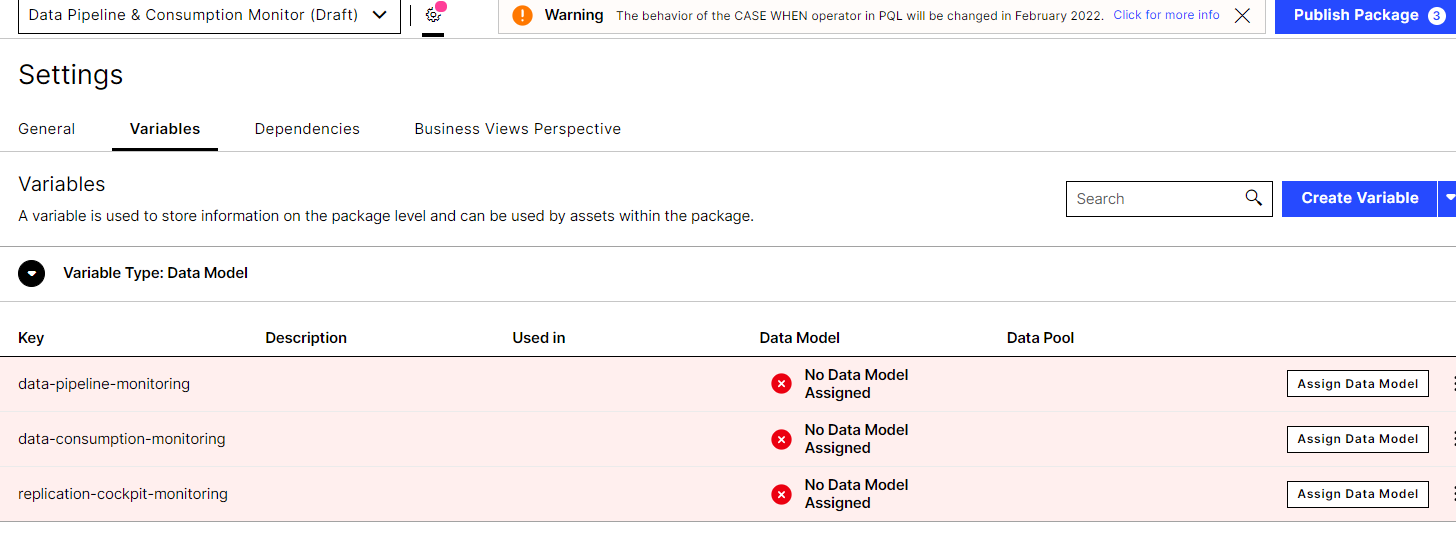
  1. imageIn Studio, you might need to reassign the Data Models manually (click on the Analysis->click on the config wheel->variables and assign DM). If the DM is not displaying, double-check step 4

Obs.:The tables are created with the first events captured after enabling the Custom Data Pipeline Monitoring. No past events are captured. The table data_consumption_updated_events is created with the first APC calculation for the team, which can take up to several days. Until then the Data Job 'Data Consumption Monitoring' will fail. The table replication_execution_finished_events is created with your the first Replication Cockpit Execution. If the Replication Cockpit is not set up, the Data Job 'Replication Cockpit Monitoring" will fail.


Best,

Gabriel


Reply