Question

Show relative frequencies

  • Oct 20, 2020 1:53 PM UTC
  • 2 replies
  • 120 views

Hi, how do i display relative frequencies in the graphs? Thanks in advance! Cheers, Olaf

2 replies

gabriel.okaba11
Celonaut
Forum|alt.badge.img+1

Hi Olaf,


You can achieve this with an OLAP table, column chart etc by adding as a KPI being the frequency / total cases

If you elaborate a little bit further, I can propose you the exact formula.


Best,

Gabriel


  • Level 0
  • Nov 23, 2021 9:24 PM UTC

Hi Olaf,


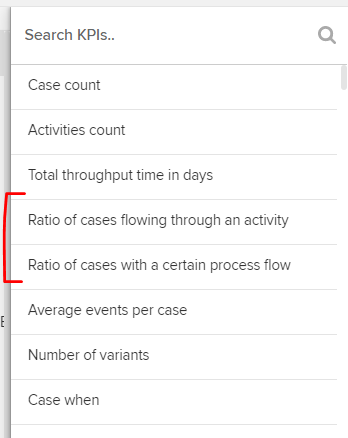
you can maybe leverage the prebuilt functionalities like in the screenshot below to create ratios. Is that what you mean by relative frequencies?

imageBest,

Kevin